


60 Years of Uncertainty
Our new index provides novel insights into an amorphous concept
“If I had to identify a theme at the outset of the new decade it would
be increasing uncertainty.”
Kristalina Georgieva, Managing Director of the IMF, Peterson Institute for
International Economics, January 17, 2020
It is well-known that uncertainty reduces the willingness of firms to hire and invest and of consumers to spend. Yet it is a nebulous concept, because it reflects uncertainty in the minds of consumers, managers, and policymakers about future events (that may or may not happen). It is also a broad concept since it relates to macro phenomena like GDP growth and micro phenomena like the growth rate of firms—as well as other events like elections, wars, and climate change.
Given all these challenges, it is not surprising that researchers have relied on different methods to measure uncertainty. One approach is based on the volatility of key economic and financial variables (Leahy and Whited 1996; Bloom 2009; Ludvigson, Ma, and Ng, forthcoming). Another method is based on text-searching newspaper archives, for example, the Baker, Bloom and Davis (2016) Economic and Policy Uncertainty index. However, these approaches share an important limitation: they are typically limited to a set of mostly advanced economies, and for many of these countries the data are available only after the early 1990s.
New measure of uncertainty
To address this limitation, we have constructed a new quarterly measure of uncertainty—the World Uncertainty Index (WUI). It covers 143 countries—all countries in the world with a population of at least 2 million. It goes back in time, providing data for the past 60 years. The index uses a single source for all countries, which allows us to compare the level of uncertainty across countries. And it captures uncertainty related to economic and political events, regarding both near-term (e.g., uncertainty created by the United Kingdom’s referendum vote in favor of Brexit) and long-term (e.g., uncertainty engendered by the impending withdrawal of international forces in Afghanistan, or tensions between the Democratic People’s Republic of Korea and the Republic of Korea) concerns.
The index is constructed by text-mining the country reports from the Economist Intelligence Unit (EIU), a business intelligence company that provides country reports on a quarterly basis. These reports cover the economy, policies, and politics of each country. We follow three steps in constructing the index. First, we compile country-specific reports on a quarterly basis from the EIU from the mid-1950s onward for 143 countries. Second, we count the number of times the word “uncertainty” (and its variants) is mentioned in these reports. Third, we normalize the total count of the word “uncertainty” according to the total number of words in each report.
To address potential concerns regarding the accuracy, reliability, and consistency of our dataset, we evaluate the index in several ways. First, we examine the narrative associated with the largest global spikes. Second, we show that the index is associated with greater economic policy uncertainty, stock market volatility, risk, and lower GDP growth, and tends to rise close to political elections.
Key findings
This new data set allows us, for the first time, to examine the historical evolution of uncertainty around the globe. Several interesting stylized facts emerge:
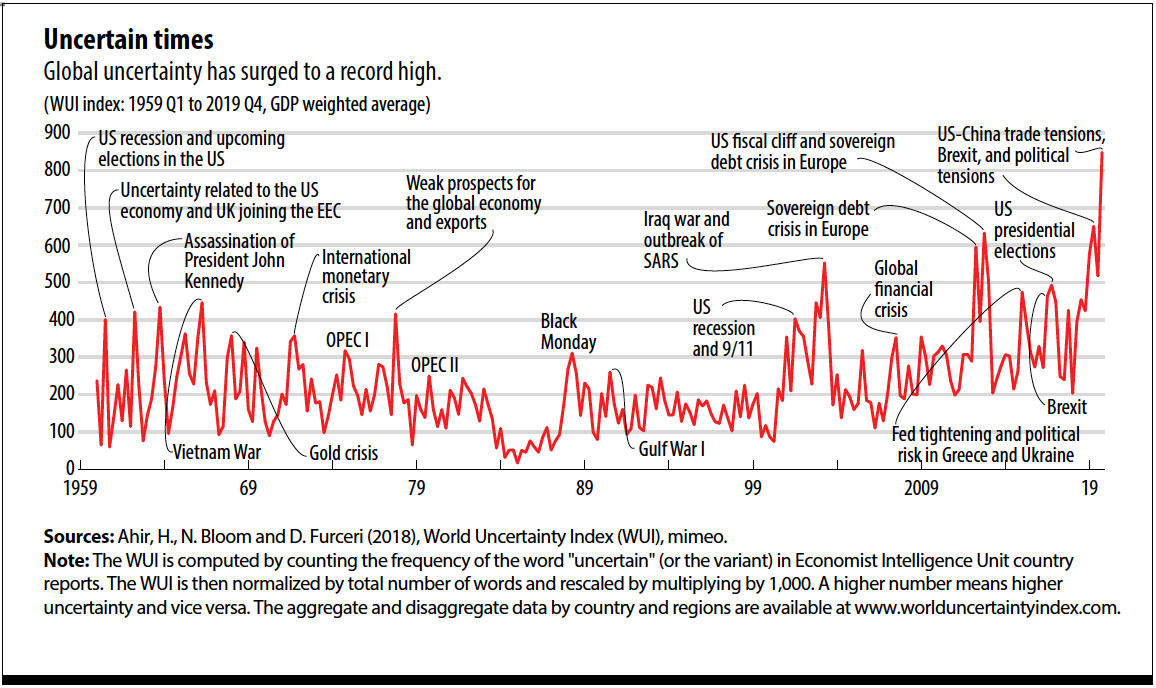
First, global uncertainty has increased significantly since 2012. The latest data for the fourth quarter of 2019 show that, after dipping in the third quarter of 2019, the aggregate index—a GDP-weighted average of 143 countries—is at an all-time high.
The recent levels of global uncertainty are also exceptional in a historical context. Looking back at the past 60 years, we see few episodes in which uncertainty has been at levels close to those observed in the past decade. Other notable historical episodes include the assassination of US President John F. Kennedy, the Vietnam War, the gold crisis in the late 1960s and the oil crises in the 1970s.
These global episodes, however, do not mean that levels of uncertainty are historically high for all countries in the world. They reflect, to a large extent, the increasing role of global factors in driving uncertainty across the globe. For example, the current level of uncertainty in China is significantly lower than the level recorded during the cultural revolution in the late 1960s, a period when China was less connected to the rest of the world.
Second, uncertainty spikes are more synchronized in advanced economies than in emerging market and low-income economies. Our analysis finds that uncertainty in emerging market and low-income economies mostly follows the global average. This is because individual country shocks are not synchronized, so they get averaged away. In contrast, uncertainty in advanced economies spikes sharply, because these countries tend to move together. Within advanced economies, uncertainty synchronization is higher among euro area countries. In addition, we find that stronger trade and financial linkages across countries lead to stronger uncertainty synchronization.
Third, the average level of uncertainty is higher in low-income economies than in emerging market and advanced economies. One potential reason for this is that developing countries appear to have more domestic political shocks like coups, revolutions, and wars; are more susceptible to natural disasters like epidemics and floods; and their economies are more volatile as they are more frequently hit by external shocks and have more limited capacity to manage these shocks.
Fourth, there is an inverted U-shaped relationship between uncertainty and democracy. As countries move from a regime of autocracy and anocracy toward democracy, uncertainty increases. As countries move from some degree of democracy to full democracy, uncertainty declines.
Finally, increases in the index foreshadow significant output declines, with the effect being larger in countries with weaker institutions.
Research uses
This data set can be extremely valuable for researchers. For instance, the fact that spikes to the index foreshadow output declines suggests that it could be used as alternative measures of economic activity when those typically employed are not available (such as quarterly GDP for many countries). The dataset can also be used to investigate a number of policy questions, including the impact of differences in the level of uncertainty across countries on key macroeconomic outcomes, such as foreign direct investment. It can likewise be used to examine the various drivers of uncertainty as well as the economic effects of policies in times of uncertainty.

HITES AHIR is a senior research officer in the IMF’s Research Department.

NICHOLAS BLOOM is the William D. Eberle Professor of Economics at Stanford University.
Opinions expressed in articles and other materials are those of the authors; they do not necessarily reflect IMF policy.
References:
Ahir, H., N. Bloom, and D. Furceri. 2018. “World Uncertainty Index,” Unpublished.
Baker, S. R., N. Bloom, and S. J. Davis. 2016. “Measuring Economic Policy Uncertainty.” Quarterly Journal of Economics 131 (4): 1593–1636.
Bloom, N. 2009. “The Impact of Uncertainty Shocks.” Econometrica 77(3): 623–85.
Leahy, J., and T. Whited. 1996. “The Effect of Uncertainty on Investment: Some Stylized Facts.” Journal of Money, Credit and Banking 28 (1): 64–83.
Ludvigson, S. C., S. Ma, and S. Ng. Forthcoming. “Uncertainty and Business Cycles: Exogenous Impulse or Endogenous Response?” American Economic Journal: Macroeconomics , forthcoming.


