


The search continues for a better gauge of prosperity than GDP alone
Gross domestic product (GDP), which measures the total output of goods and services in an economy, has flaws when used to gauge the well-being of a nation’s residents.
For example, to the question of whether people in the United States are better-off in 2021 than they were before the COVID-19 pandemic, the answer would be yes, slightly, if per capita GDP is the yardstick. That’s because real (inflation-adjusted) per capita GDP rose from $58,333 in the fourth quarter of 2019 to $58,454 in the second quarter of 2021.
But that affirmative answer is likely to ring hollow to many. The United States does not appear better-off. It experienced a fourth wave of COVID-19 infections in late 2021 that left thousands dead. Many businesses are still shuttered, and millions remain unemployed. The country is deeply divided socially and politically. GDP captures neither the enormous human costs of the pandemic, nor the nation’s social and emotional disruptions.
The recognition that GDP cannot encompass many dimensions of well-being has prompted efforts to develop measures that reflect a more complete account of what people care about. The idea is not to give up on GDP—nor to replace it with some other one-dimensional measure, such as self-reported life satisfaction, which, like GDP, gives only a partial and hence potentially misleading picture. Instead, a measure that captures many dimensions of national well-being and complements GDP is needed. Fleurbaey and Blanchet (2013) provide an overview of this idea as well as many other so-called Beyond GDP proposals and initiatives.
In this article, we discuss the Human Development Index (HDI), an alternate measure of well-being that has been influential in developing economies. We then turn to our proposed approach to measuring national well-being, which is based on aggregating people’s survey responses about many dimensions of their welfare.
The HDI transforms several dimensions of well-being into a single yearly index to rate a country’s performance. Sen was leery of aggregating measures of different capabilities. But when policymaking requires trade-offs, judging whether one policy is better than the alternatives requires an index. Moreover, having a single number makes it difficult for government officials to cherry-pick whichever statistic makes things look rosiest. Creating an index requires weighting the capabilities relative to one another.
For GDP, prices provide the weights for the goods and services it includes. But because GDP relies on market transaction data, it fails to include things human beings care about that do not run through the market—such as leisure time, relationships with family and friends, and emotional experiences such as anxiety and sense of purpose. Moreover, although prices may represent the relative importance of different market goods and services to the well-being of an individual or household, they do not countenance the possibility that a dollar spent by a family in poverty might do more for national well-being than one spent by a billionaire’s family.
Constructing the HDI
On its website, the United Nations Development Programme (UNDP) describes the HDI as “created to emphasize that people and their capabilities should be the ultimate criteria for assessing the development of a country, not economic growth alone.” But after those lofty words, the description turns to technical detail: “HDI is a summary measure of average achievement in key dimensions of human development: a long and healthy life, being knowledgeable, and having a decent standard of living. The HDI is the geometric mean of normalized indices for each of the three dimensions.”
The technical details determine how the UNDP puts into practice its lofty goal: which dimensions of well-being (or capabilities) the HDI tracks, what it leaves out, and what relative importance it gives to the things it does track. For example, according to the geometric mean used by the HDI, a percentage change in HDI is the equally weighted average of the percentage changes of its components.
The HDI is surely the best-known practical application of Sen’s capabilities approach. It provides a single, simple number that both summarizes the state of a country at a point in time and is easy to construct and explain.
Getting to less arbitrary
Still, although it captures more dimensions of well-being than GDP does, the HDI is arbitrary in its choice of what to include and how to weight what it does cover. The goal of an enhanced well-being index is to include many more than three dimensions of well-being and to weight them based on the values of the people in the country.
A major reason the HDI focuses on longevity, education, and income is that when the index was introduced in 1990, these important dimensions of a good life were among the few variables being widely measured across countries in a reasonably comparable way. Unavailability of data has similarly constrained the reach of other Beyond GDP initiatives—such as the Genuine Progress Indicator and the Organisation for Economic Co-operation and Development’s (OECD’s) Better Life Index. But lack of current data should not constrain our vision of what a good index should look like.
Some Beyond GDP initiatives have gotten around these data constraints by using surveys, which can be conducted relatively cheaply around the world in real time. Indeed, real time is crucial to policymaking. For example, how the HDI performed during the pandemic is still unknown because, at the time of this writing, the latest numbers available are for 2019.
Some researchers have proposed using single-question survey measures of happiness or life satisfaction. However, research, including some of our own with Alex Rees-Jones of the University of Pennsylvania, suggests that answers to these survey questions do not capture the full range of what people care about when they make choices. Partly to address this shortcoming, other Beyond GDP initiatives, such as those of the OECD and the UK Office of National Statistics, ask additional survey questions to measure dimensions of well-being other than happiness or life satisfaction. But multiple survey questions reintroduce the question of how to weight the dimensions of well-being relative to one another.
Our research makes clear the importance including multiple components in a measure of national well-being and the importance of getting the weighting right. Those issues are at the core of our efforts to construct a theoretically sound well-being index. The weights we recommend are relative marginal utilities—traditionally defined as the additional satisfaction an individual realizes from one more unit of a good or service, but in this case from one more unit of an aspect of well-being. We propose to estimate marginal utilities based on stated preferences in specially designed surveys, described below.
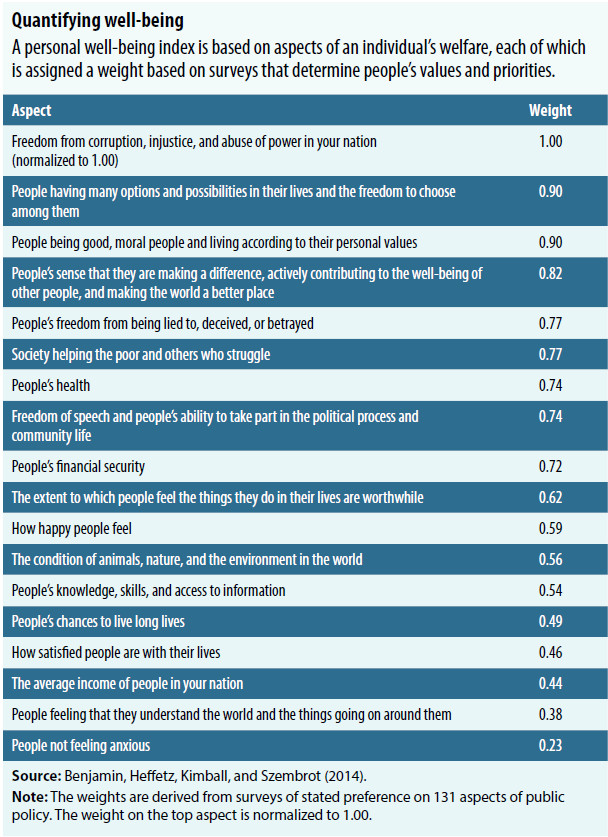
Some older results illustrate our approach, which we are still developing. In Benjamin, Heffetz, Kimball, and Szembrot (2014) we asked survey questions about 136 aspects of well-being—a list that aimed to comprehensively reflect all proposed aspects of well-being. (An actual index should comprise fewer aspects of well-being and avoid, or adjust for, conceptual overlaps.) The table shows estimated weights based on policy choices—described as “national policy questions that you and everyone else in your nation vote on.” Respondents chose between pairs of hypothetical policies, which involved trade-offs between aspects of well-being. Our statistical procedure inferred weights for the aspects of well-being based on respondents’ choices, so that an aspect of well-being is assigned higher weight if it has a bigger impact on the policy respondents preferred. Because of space constraints, the table illustrates the results using 18 of the 136 aspects of well-being: the three with the highest weights, other interesting aspects in the top 10, every aspect that seems closely related to HDI components, other aspects for which data are widely collected, and an aspect on the natural environment. We normalize the weight on the top aspect—freedom from corruption, injustice, and abuse of power—to 1.00.
Although many things could be said about the table, we limit ourselves to three points.
Many of the top aspects are clearly capabilities in Sen’s sense, including the first one, which does not guarantee a good life, but helps make one possible.
A number of important aspects of well-being—with weights of at least 75 percent of the top aspect—are missing from many measures of national well-being, such as the HDI.
The weights for many aspects of well-being that have received much attention are well below the weights for those at the top. For example, “people not feeling anxious”—one of four aspects collected in large samples of individuals by the UK Office of National Statistics—is weighted less than a quarter of the top aspect. For those relevant to the HDI, “people’s health” and “people’s financial security” have almost three-quarters the weight of the top aspect, but others—knowledge, skills, and access to information; understanding the world; long lives; and average income—have weights no higher than 54 percent of the top aspect.
Using stated preference
To construct personal well-being indices—which are aggregated to develop a national well-being index—our approach involves asking two types of survey questions about the aspects of well-being: ratings and trade-offs. In a rating question, respondents move a slider from 0 to 100 to indicate their level of an aspect of well-being over the past year. In a trade-off question, respondents choose between two options. In each trade-off option, the level of one or more aspects of well-being is slightly higher or slightly lower than the reported level in the rating question. In the illustration above, the choices between national policies are examples of trade-off questions.
In Benjamin, Heffetz, Kimball, and Szembrot (2014) we argue that for an individual, a well-being index can be constructed similarly to the way consumption is measured in the national accounts that are used in calculating GDP. Consumption calculations rely on quantities and prices. To compute a well-being index, reported levels of aspects of well-being from the rating questions are substituted for quantities, while the weights reported in the table are used in place of prices. The weights—derived from the trade-off questions that reveal the choices people make between aspects of well-being—represent people’s values and priorities.
In Benjamin, Cooper, Heffetz, and Kimball (2017) we lay out how much remains to be done to develop a full national well-being index that is consistent with modern welfare theory in economics. Here are three areas in which we have made the most progress to date.
First, large differences in how different people use any given scale for measuring their well-being make well-being measures seem subjective. We developed what we call “calibration questions” to test for systematic differences in people’s scale use—for example, some people use the whole scale, from 0 to 100, and others use only 50 to 100. We can use calibration ratings to correct for some such scale-use differences—both across individuals and even potentially across time for the same individual.
Second, we hypothesize that the trade-offs people make between different aspects of well-being are likely to differ according to demographics—such as age and education—and how well-off people are overall. We can use such systematic tendencies to create reasonable weights without needing a huge amount of data to estimate each individual’s weights.
Third, we propose that the index take into account inequality—not just in income or wealth, but in personal well-being. We do not assume that an index of personal well-being can be simply added up across people to get a national index. That would imply, for example, that national well-being is at the same level whether everyone is at 50 or half the people are at 10 and half are at 90. If as a society we judge the more equal situation to be better, that society has some degree of aversion to well-being inequality, which requires employing a level of inequality aversion to transform the personal well-being indices before totaling them to obtain a national index.
“What gets measured, gets treasured” is an important maxim. In the well-being sphere, this means policymakers and development practitioners should carefully consider which metrics they monitor. Perhaps equally important, though, is properly weighting them. We can add a new adage: “What we give weight to, we value.”

DANIEL BENJAMIN is a professor at the University of California, Los Angeles.

KRISTEN COOPER is an associate professor at Gordon College.

ORI HEFFETZ is an associate professor at The Hebrew University of Jerusalem and Cornell University.

MILES KIMBALL is a professor at the University of Colorado, Boulder.
Opinions expressed in articles and other materials are those of the authors; they do not necessarily reflect IMF policy.
References:
Benjamin, Daniel J., Kristen B. Cooper, Ori Heffetz, and Miles S. Kimball. 2017. “Challenges in Constructing a Survey-Based Well-Being Index.” American Economic Review 107 (5): 81–85.
Benjamin, Daniel J., Ori Heffetz, Miles S. Kimball, and Nichole Szembrot. 2014. “Beyond Happiness and Satisfaction: Toward Well-Being Indices Based on Stated Preference.” American Economic Review 104 (9): 2698–735.
Fleurbaey, Marc, and Didier Blanchet. 2013. Beyond GDP: Measuring Welfare and Assessing Sustainability. Oxford, UK: Oxford University Press.
Nussbaum, Martha. 2011. Creating Capabilities: The Human Development Approach. Cambridge, MA: Harvard University Press.
Sen, Amartya. 1985. Commodities and Capabilities. Oxford, UK: Oxford University Press.


