


Frequently Asked Questions are divided into four topics. Click on the corresponding question to view the answers. Submit all other questions and comments using WEO Data Question Form
1) WEO Database and Publication
- How often is the online WEO database and publication updated?
- What is the WEO Update and how can I access the data?
- Is there a way I can receive notification via e-mail when a new WEO report is released?
- What changes have been made to the WEO database in this issue compared to the previous edition? Where can I find a list of changes that have been made over time?
- Is there any way I can save my query?
- Could I use WEO data for my written work?
- What explains differences between WEO and IFS data and/or the latest data available from the source?
- What is the methodology used to produce the forecasts?
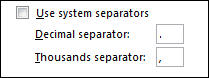
- I am getting an error when I click on the option to use a comma instead of a period to separate whole numbers from decimals. In this instance, the thousands separator remains a comma and there is no way for me to know the difference between the thousands separator and the decimal separator. Is there a way to resolve this?
- Where can I send questions about the WEO and other IMF publications/databases referenced in the WEO?
2) Data Availability and Coverage
- How do I know if data are actual, preliminary, or projected?
- Do you have higher frequency data such as quarterly or monthly data?
- Do you have data prior to 1980?
- Do you have long- and/or medium-term forecasts?
- Where can I access the historical WEO forecasts from the previous publications?
- Are there any other data available besides what is downloadable from the WEO database?
3) Specific Data Series
- What is the constant price base year for GDP? Is it constant across all countries?
- Why do the GDP deflator (NGDP_D) and/or the Consumer Price Index (PCPI) not equal 100 in the specified base year?
- Is there a real global GDP dollar series that can be used to compare economy size across countries?
- How often are estimates revised?
- What is the difference between "Gross domestic product, current prices" and "Gross domestic product corresponding to fiscal year, current prices?"
- For the countries that adopted the euro, how did you convert the series expressed in national currency?
- What is the difference between General Government Gross and Net Debt?
- Why does the world current account balance not equal to zero?
- Does the WEO publish exchange rate data?
- Is there a list of WEO countries that are chain-weighted?
- Where can I find more information on the IMF Commodity Prices?
4) WEO Country Groups and Purchasing Power Parity (PPP)
- Is there a reference page available listing which countries are included in the aggregates—for example, advanced economies, ASEAN-5, etc.?
- How does the WEO categorize advanced versus emerging market and developing economies?
- How are the low-income developing countries (LIDCs) and the emerging market and middle-income economies (EMMIEs)in the WEO publications tables classified?
- Which countries are included in the aggregated European Union data series?
- What is a "purchasing-power-parity (PPP)" exchange rate?
- What is "Gross domestic product, current prices (purchasing power parity; international dollars"?
- How often does the WEO update the PPP implied conversion rate and the GDP based on PPP valuation of country GDP series?
- How is GDP at PPP exchange rates used to calculate WEO country group data? Will I be able to calculate aggregated data based on a different country grouping using PPP exchange rates?
- What other methodologies are used to calculate WEO country group (aggregated) data?
Submit all other questions and comments using WEO Data Question Form.
1) WEO Database and Publication
Q. How often is the online WEO database and publication updated?
The WEO database and publication are updated and published twice a year, usually in April and October, as documentation for meetings of the International Monetary and Financial Committee and form the main instruments of the IMF's global surveillance activities.
Official announcements regarding the WEO release date come from the IMF Communications department via IMF.org, email alerts, and other official channels. As a guideline, past WEOs have been released on the Tuesdays prior to the Annual and Spring Meetings of the International Monetary Fund and the World Bank Group. The schedule for the meetings can be found here: https://0-meetings-imf-org.library.svsu.edu/en/Index.
Q. What is the WEO Update and how can I access the data?
In response to the growing demand for more frequent forecast updates, the WEO Update is published in January and July between the two main WEO publications released usually in April and October. The WEO Update includes the updated WEO Projections Overview (Table 1) and provides revised real GDP growth projections for two years for selected economies only. The full WEO database is not provided for this interim WEO report as it is a partial exercise. You may access the latest WEO Update from WEO publication page (https://0-www-imf-org.library.svsu.edu/en/publications/weo).
Q. Is there a way I can receive notification via e-mail when a new WEO report is released?
For WEO updates and news, you can subscribe to our free e-mail notification at https://0-www-imf-org.library.svsu.edu/en/email-subscription/login.
A list of the changes that have been implemented with each WEO edition are listed in the Changes to the Database found in respective WEO database page.
Q. Is there any way I can save my query?
A. Unfortunately, this feature is currently not available currently. You can, however, bookmark the web address when you download the report. After you complete a query where you have a preview of the final report that you would like to download, you can bookmark the URL in the address bar of your window.
Please note that the location of the WEO changes every publication. To get to the same table but with the updated data from new WEO database, you will have to modify the bookmarked web address (for example, https://0-www-imf-org.library.svsu.edu/en/Publications/WEO/weo-database/2024/October/weo-report?...). Please adjust the year/month part of the address and refresh the page.
We also encourage you to use different options under “Entire Dataset” section such as files with tab delimited values and file in SDMX format.
Q. Could I use WEO data for my written work?
You are welcome to use WEO data for written work if you cite the publication/database accordingly. For copyright and usage information on IMF work see http://0-www-imf-org.library.svsu.edu/external/terms.htm.
The data appearing in the World Economic Outlook are provided to the Research Department at the time of the WEO exercises. The historical data and projections are based on the information gathered by the IMF country desk officers in the context of their missions to IMF member countries and ongoing analysis of the evolving situation in each country. Historical data are updated on a continual basis as more information becomes available, and structural breaks in data are often adjusted to produce smooth series with the use of splicing and other techniques. IMF staff estimates continue to serve as proxies for historical series when complete information is unavailable.
The data published in the Statistics Department's International Financial Statistics (IFS) are gathered as part of an ongoing data collection effort in which member country statistical agencies provide public statistics to the IMF.
Data from the country source are updated on their own schedule. Each publication considers the most recent revisions available, prior to publication. The data provided in the WEO might have more (estimated) or less time coverage than what is provided by the authorities, but that decision is at the discretion of the IMF country desk officers. For a specific country-series pair, the date (month and year) of the last update is indicated in the notes option you may choose to append to the report at the end of a query.
Because of differences in data collection techniques, methodological issues, focus, and timing, the data in the IFS and the World Economic Outlook may differ. Check our statement on revisions to the data and deviations from other official sources, such as IFS, here: https://0-www-imf-org.library.svsu.edu/en/Publications/WEO/weo-database/Disclaimer.
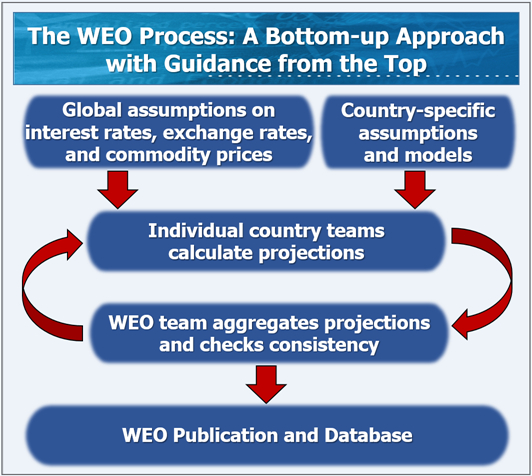
Q. What is the methodology used to produce the forecasts?
The IMF’s World Economic Outlook uses a “bottom-up” approach in producing its forecasts; that is, country teams within the IMF generate projections for individual countries. These are then aggregated, and through a series of iterations where the aggregates feed back into individual countries’ forecasts, forecasts converge to the projections reported in the WEO.
Because forecasts are made by the individual country teams, the methodology can vary from country to country and series to series depending on many factors. To get more information on a specific country and series forecast, you may contact the country teams directly; from the Countries tab on the IMF website, click on a country and you will see a ”Contact Us” link on the left side.
The problem is not due to the way the data is downloaded but in the way your spreadsheet program reads in the data. The query file you download is a tab separated file (tsv). If you click the option to use a comma as the decimal separator, the number 12,123.54 is saved as 12123,54 in this tsv file. However, when you bring it into your spreadsheet program, say Excel, it reads this comma as a digit separator and not a decimal separator, which results in the error you identified. To correct this, please check to make sure that in Excel > Excel Options > Advanced > Editing Options you have the following specified:
Q. Where can I send questions about the WEO and other IMF publications/databases?
Questions about the WEO should be submitted using the WEO Data Question Form. Questions about other IMF publications/databases should be sent to the appropriate email address listed below:
- Databases found in IMF DATA including International Financial Statistics (IFS), Balance of Payments Statistics (BOPS), Direction of Trade Statistics (DOTS), and Government Finance Statistics (GFS) – tickets@imfdata.uservoice.com
- IMF Primary Commodity Prices – commodities@imf.org
- Fiscal Monitor - fiscalmonitor@imf.org
- Global Financial Stability Report (GFSR) – GFSRquery@imf.org
- G-20 Surveillance Note - resmsra@imf.org
- All other IMF publications and publication dates – publications@imf.org
2) Data Availability and Coverage
Q. How do I know if data are actual, preliminary, or projected?
In the table report at the end of a query, the shaded cells indicate IMF staff estimates. Non-shaded cells are therefore actual data. This information is also provided in the Country/Series-specific data notes option you may choose to append to the report. Finally, the downloadable tab-delimited file at the end of a query will always include a column specifying the year of the latest actual data (or a zero if the entire series is estimated). Note that even if the data are marked as “actual”, these data can still be revised in the future. Check our statement on revisions to the data here: https://0-www-imf-org.library.svsu.edu/en/Publications/WEO/weo-database/Disclaimer.
We do not provide this information for WEO country groups' data. At the country group level, the year of the publication is assumed to be the start of the forecast period. Note that the shaded/forecast years in the World Economic Outlook report do not match the shaded/forecast years in the online database because the purpose of the shading in the report is to emphasize the forecast period common to all countries.
Q. Do you have higher frequency data such as quarterly or monthly data?
We do not publish monthly or quarterly data in the online WEO database.
Q. Do you have data prior to 1980?
No. We do not provide data prior to 1980 due to difficulties in verifying the accuracy of the historical data. However, you may find more historical coverage in IMF Data which contains data from other IMF publications (Balance of Payments, Direction of Trade, Government Finance Statistics, and International Financial Statistics).
Q. Do you have long- and/or medium-term forecasts?
We publish 5-year forecasts for many but not all indicators and country groups in the database. For some indicators and country groups, we only publish 2 years of forecast data.
Q. Where can I access the historical WEO forecasts from the previous publications?
As part of the efforts to enhance transparency, historical forecasts from the April 1990 WEO for select key indicators are compiled into one Excel file. It is found in respective WEO database page. For all other indicators, they may be found in the archived WEO databases web pages dating back to the April 1999 WEO.
Q. Are there any other data available besides what is downloadable from the WEO database?
The historical data and projections appearing in the WEO are based on information gathered by the IMF country desk officers in the context of their missions to IMF member countries and ongoing analysis of the evolving situation in each country. The data provided might have more (estimated) or less time coverage than what is provided by the authorities, but that decision is at the discretion of the IMF country desk officers. All of the data that can be released to the public are already incorporated into the WEO online database. Missing data in the table downloads and CSV files are indeed unavailable and not a result of a technical issue. Data underlying charts/figures in the WEO publication can be found on the publication’s webpage. Some indicators are not included in the online database and are reserved for IMF staff research (IMF working papers, IMF staff reports, etc.).
Please visit the IMF Data page for more databases available. Selected online IMF data sources matrix can be used to identify which online IMF data source includes the information you are looking for.
3) Specific Data Series
Q. What is the constant price base year for GDP? Is it constant across all countries?
The information on base years for national accounts at constant prices is gathered from IMF country desk officers and is country specific. This information is provided in the Country Information document found in respective WEO database page. Country/Series-specific data notes option you may choose to append to the report at the end of a query, or Table G of the most recent WEO publication’s Statistical Appendix.
There are various reasons why the data for a price series may not equal 100 in the base year (original data in fiscal years or set equal to 100 in a specific month/quarter, etc.). See the country/series-specific data notes option you may choose to append to the report at the end of a query for explanations. For the GDP deflator, see the base year notes attached to either the GDP in current prices or GDP in constant prices.
We do not report the value of constant price GDP in a common currency (say U.S. dollars) for the world.
One way to convert an individual country's real GDP series to U.S. dollars is to do the following:
1) Take the current GDP level for that country in terms of U.S. dollars in the year specified as that country's base year (see Country Information document found in respective WEO database page).
- Series: Gross domestic product, current prices, U.S. dollars (NGDPD)
2) Extend the series from the base year value forwards and backwards by applying the growth rates of real GDP in local currency.
- Series: Gross domestic product, constant prices, Annual percent change (NGDP_RPCH)
By following this procedure, a country's real GDP is in terms of U.S. dollars but maintains the growth rates of the real GDP series.
Q. How often are estimates revised?
The number of revisions to each country's data is country specific. We collect historical data and forecasts from each IMF country desk officer, and in turn, the national authorities provide the country desk officer with their most current updates. The data provided in the WEO might have more (estimated) or less time coverage than what is provided by the authorities, but that decision is at the discretion of the IMF country desk officers. Although there may be several iterations, each publication takes into account the most recent revisions available, prior to publication. For a specific country-series pair, the date (month and year) of the last update is indicated in the notes option you may choose to append to the report at the end of a query.
"Gross domestic product corresponding to fiscal year, current prices" is the country's GDP based on the same period during the year as their fiscal data. In the case of countries whose fiscal data are based on a fiscal calendar (e.g., July to June), this series would be the country's GDP over that same period. For countries whose fiscal data are based on a calendar year (i.e., January to December), this series will be the same as "Gross domestic product, current prices." The "Gross domestic product corresponding to fiscal year, current prices" series is only used to express fiscal data as a percent of GDP.
The WEO used the fixed conversion rates between the euro and the currencies of the member states adopting the euro to transform the data prior to 1999. The following are the irrevocable euro conversion rates as adopted by the Council of the European Union on January 1, 1999, unless otherwise noted:
| 1 euro | = | 13.7603 | Austrian schillings |
| = | 40.3399 | Belgian francs |
|
| = | 7.53450 |
Croatian kuna (established on January 1, 2023) |
|
| = | 0.585274 |
Cyprus pound (established on January 1, 2008) |
|
| = | 1.95583 |
Deutsche marks |
|
| = | 15.6466 |
Estonian krooni (established on January 1, 2011) |
|
| = | 5.94573 |
Finnish markkaa |
|
| = | 6.55957 |
French francs |
|
| = | 340.750 |
Greek drachmas (established on January 1, 2001) |
|
| = | 0.787564 |
Irish pound |
|
| = | 1,936.27 |
Italian lire |
|
| = | 0.702804 |
Latvian lat (established on January 1, 2014) |
|
| = | 3.45280 |
Lithuanian litas (established on January 1, 2015) | |
| = | 40.3399 | Luxembourg francs |
|
| = | 0.42930 |
Maltese lira (established on January 1, 2008) |
|
| = | 2.20371 |
Netherlands guilders |
|
| = | 200.482 |
Portuguese escudos |
|
| = | 30.1260 |
Slovak koruna (established on January 1, 2009) |
|
| = | 239.640 |
Slovenian tolars (established on January 1, 2007) |
|
| = | 166.386 |
Spanish pesetas |
Q. What is the difference between General Government Gross and Net Debt?
General government gross debt consists of all liabilities that require payment or payments of interest and/or principal by the debtor to the creditor at a date or dates in the future. This includes debt liabilities in the form of SDRs, currency and deposits, debt securities, loans, insurance, pensions and standardized guarantee schemes, and other accounts payable. Thus, all liabilities in the GFSM 2001 system are debt, except for equity and investment fund shares and financial derivatives and employee stock options. On the other hand, general government net debt refers to gross debt of the general government minus its financial assets in the form of debt instruments. Examples of financial assets in the form of debt instruments include currency and deposits, debt securities, loans, insurance, pension, and standardized guarantee schemes, and other accounts receivable. For more information, see the Country/Series-specific notes at the end of your query. To avoid double counting, the data are based on a consolidated account (eliminating liabilities and assets between components of the government, such as budgetary units and social security funds).
Q. Why does the world current account balance not equal to zero?
In principle, since one country's export is another country's import, current account balances across the world should sum to zero. In practice, however, this is not the case. While a discrepancy is difficult to analyze by its very nature, there is broad agreement that the global current account discrepancy likely reflects in part the following economic factors:
- transportation lags, if exports are recorded in one year, while the corresponding imports are not recorded until the next;
- underreporting of investment income, partly related to tax evasion and the growth of offshore centers;
- asymmetric valuation, where the export and import of the same good are valued at different prices; and
- data quality issues, especially for transportation services and workers' remittances.
Q. Does the WEO publish exchange rate data?
The WEO does not provide exchange rate data. You can download official exchange rate data for selected currencies from IMF's "Data" section (https://0-www-imf-org.library.svsu.edu/en/Data) under the heading "Exchange Rates Data." Finally, IMF Data which contains data from other IMF publications (Balance of Payments, Direction of Trade, Government Finance Statistics, and International Financial Statistics) provides this data as well.
Q. Is there a list of WEO countries that are chain-weighted?
You may find the list of chain-weighted countries in Table G of the Statistical Appendix and in the Country Information document found in respective WEO database page. In addition, this information is included in the Country/Series-specific notes that you can choose to append to your download report at the end of a query. At this time, this only applies to the "Gross Domestic Product, constant prices" series.
Q. Where can I find more information on the IMF Commodity Prices?
The IMF Commodity Prices are provided by the Commodities team of the Research Department. For more information, see https://0-www-imf-org.library.svsu.edu/en/Research/commodity-prices. You may also e-mail them at commodities@imf.org.
4) WEO Country Groups and Purchasing Power Parity (PPP)
The list of Country Groups can be found in the Groups and Aggregates found in respective WEO database page. In addition, the countries/territories included in the different WEO Country Groups are available from Step 1 of the "By Country Groups" query. Hover your mouse on the icon beside the Country Group you are interested in to view its country composition.
Q. How does the WEO categorize advanced versus emerging market and developing economies?
The main criteria used by the WEO to classify the world into advanced economies and emerging market and developing economies are (1) per capita income level, (2) export diversification—so oil exporters that have high per capita GDP would not make the advanced classification because around 70% of its exports are oil, and (3) degree of integration into the global financial system. In the first criteria, we look at an average over a number of years given that volatility (due to say oil production) can have a marked year-to-year effect. For the first criterion, the data source is the WEO database; for the second criterion, it is the UN COMTRADE database; and for the last criterion, it is the IMF’s Balance of Payments Statistics Database. Note, however, that these are not the only factors considered in deciding the classification of countries. As it says in the WEO Statistical Appendix, "This classification is not based on strict criteria, economic or otherwise, and it has evolved over time. The objective is to facilitate analysis by providing a reasonably meaningful method of organizing data." Reclassification only happens when something marked changes or the case for change in terms of the three criteria above becomes overwhelming. For example, Lithuania joining the euro area was a significant change in circumstances that warranted a reclassification from an emerging market and developing economy to an advanced economy. Most reclassifications in recent years were related to countries joining the euro area.
The LIDCs are countries that have per capita income levels below a certain threshold (based on $2,700 in 2017 as measured by the World Bank’s Atlas method and updated following new information in early 2024), structural features consistent with limited development and structural transformation, and insufficiently close external financial linkages to be widely seen as emerging market economies. The EMMIEs group comprises emerging market and developing economies that are not classified as LIDCs.
Q. Which countries are included in the aggregated European Union data series?
The historical aggregated data for the European Union (EU) are updated to include all current EU member countries throughout the entire time period at the time of publication. For example, when the EU-27 became EU-28 in 2013, all historical and projected data were recalculated to reflect 28 member countries. This methodology ensures that the time series reflect changes in economic conditions and not changes in the country group composition. The same concept applies to the "euro area" aggregate and all other WEO economic, analytical, and regional country groups.
As of February 1, 2020, the United Kingdom is no longer part of the European Union. Data for the United Kingdom are no longer included in the European Union composites starting with the April 2020 WEO.
Q. What is a "purchasing-power-parity (PPP)" exchange rate?
The Purchasing-power-parity (PPP) exchange rate (or conversion rate) between two countries is the rate at which the currency of one country needs to be converted into that of a second country to ensure that a given amount of the first country's currency will purchase the same volume of goods and services in the second country as it does in the first. In the WEO online database, the implied PPP conversion rate is expressed as national currency per current international dollar.
The International Comparisons Program (ICP) is a global statistical initiative that produces internationally comparable Purchasing Power Parity (PPP) estimates. The PPP estimates maintained and published by the World Bank, the OECD, and other international organizations, are used by WEO to calculate its own PPP weight time series. Currently, WEO PPP exchange rates are based on the ICP’s 2021 report. For more information, you can go to the World Bank’s ICP page.
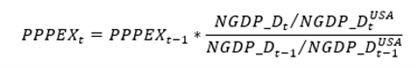
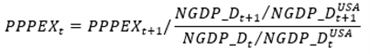
The PPP exchange rate in the WEO database comes from a calculation that starts with the PPPs reported by the ICP for 2017–21, which is then extended backwards and forwards by the growth in relative GDP deflators (the deflator of a country divided by the deflator of the United States).
Extrapolation forward (years following 2021):
Extrapolation backward (years prior to 2017):
The advantages and disadvantages of using PPP exchange rates rather than market exchange rates are discussed in the Finance & Development article "PPP Versus the Market, Which Weight Matters?" (March 2007) and Box 1.2 of the September 2003 World Economic Outlook (WEO).
Also referred to as simply PPP GDP, it is calculated by dividing a country's nominal GDP in its own currency by the PPP exchange rate. It is used as the main weights in the WEO’s aggregate calculation.
Nominal gross domestic product in purchasing-power-parity international dollars:

Nominal gross domestic product based on purchasing-power-parity international dollars share of world total:
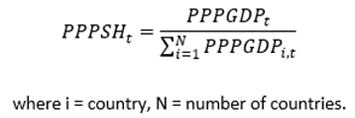
The WEO updates the PPP implied conversion rate when the ICP releases its estimates for the most recent survey year. The current PPP implied conversion rates come from the PPPs reported in the ICP 2021 report published in May 2024. The PPP implied conversion rate for non-survey years is updated at every WEO release using the most recent nominal GDP and relative GDP deflators per the methodology described in the previous question. Similarly, the GDP based on PPP valuation of country GDP series is updated using the data in the most recent WEO.
Regarding the latest PPP revisions, see Box A2 of the October 2024 WEO for a summary of the revised purchasing-power-parity-based weights. For the past updates, please refer to Box 1.1 of the October 2020 WEO, “Revised Purchasing Power Parity Weights” in the July 2014 WEO Update, Box A2 of the April 2004 WEO, Box A1 of the May 2000 WEO, and Annex IV of the May 1993 WEO.
Country Group data or aggregates relating to the domestic economy, whether growth rates or ratios, are weighted by GDP valued at purchasing-power-parities (series PPPGDP in published datasets) as a share of world total or country group total. Note that this PPPGDP weight is time-varying and that the country group composites will only be calculated when 90 percent or more of the weighted group data is represented, unless noted otherwise.
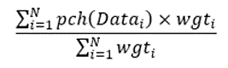
Taking the consumer price index (CPI) inflation for the advanced economies as an example, the weighted average of inflations (CPIt/CPIt-1) for the advanced economies is calculated following below formula.
Growth rate weighted average:
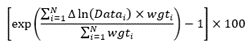
For the inflation of emerging market and developing economies (EMDE), the inflations of individual EMDE economies are based on logarithmic differences, log(CPIt)-log(CPIt-1), and the aggregates are calculated as geometric averages. This exception only applies to the inflation series of all EMDE-related groups and the world.
Geometric weighted aggregate:
For further detail on the PPP-based weights, please refer to this link: http://0-www-imf-org.library.svsu.edu/external/pubs/ft/wefs/1993/eng/studies/pdf/93WEOss3.pdf.
Also note that a certain datapoint may not be published upon country team’s request. In that case, the exact replication of the aggregate including that country-year may not be possible using the published data.
Q. What other methodologies are used to calculate WEO country group (aggregated) data?
In the Table 1 of WEO, the “World Output” (series NGDP_RPCH in published dataset) is calculated using PPP GDP as weights as discussed in other questions. The “World Growth Based on Market Exchange Rates” under Memorandum section (series NGDP_RPCHMK in published dataset) is based on an alternative weight, calculated as the three-year trailing average of nominal GDP in U.S. dollars (NGDPD):

See the WEO Aggregates section of the Groups and Aggregates document found in respective WEO database page for more information.