Press Release: Divergent Economic Performance Continues Across the Middle East
November 11, 2012
Press Release No. 12/423November 11, 2012
The economic outlook for the Middle East and North Africa region is mixed. Most of the region’s oil-exporting countries are growing at healthy rates while the oil importers face subdued economic prospects, the IMF says in its latest assessment.
The IMF’s Regional Economic Outlook for the Middle East and Central Asia http://0-www-imf-org.library.svsu.edu/external/pubs/ft/reo/2012/mcd/eng/mreo1112.htm, released November 11 in Dubai, projects growth in the Middle East and North Africa region at 5.1 percent in 2012, up from 3.3 percent in 2011.
Owing to higher oil prices and production, the region’s oil-exporting countries—Algeria, Bahrain, Iran, Iraq, Kuwait, Libya, Oman, Qatar, Saudi Arabia, the United Arab Emirates, and Yemen—are forecast to expand by 6.6 percent in 2012 before moderating in 2013.
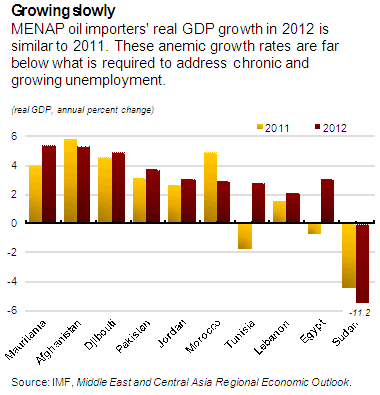
But faced with a difficult external environment, growth among the region’s oil importers—Afghanistan, Djibouti, Egypt, Jordan, Lebanon, Mauritania, Morocco, Pakistan, Sudan, and Tunisia—will register just above 2 percent in 2012. In the Arab countries in transition, continued domestic disruptions are also holding back growth.
“The biggest challenge facing governments in the Arab countries in transition is how to manage the rising expectations of populations that are becoming increasingly impatient to see a transition dividend at a time when there are threats to near-term macroeconomic stability and the margin for policy maneuver is limited,” Masood Ahmed, Director of the IMF’s Middle East and Central Asia Department, told a press conference in Dubai.
Oil exporters’ economies are buoyant
The region’s oil-exporting countries are expected to post solid growth in 2012, largely on account of Libya’s better-than-expected post-conflict recovery. In the countries of the Gulf Cooperation Council, growth remains robust, supported by expansionary fiscal policies and accommodative monetary conditions, but is expected to slow from 7½ percent in 2011 to 3¾ percent in 2013 as oil production reaches a plateau.
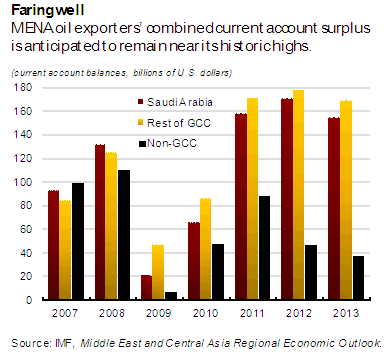
The price of oil is expected to remain above $100 per barrel in 2012–13. As a result, the oil exporters’ combined current account surplus is anticipated to remain near its historic high of about $400 billion in 2012. This has helped governments to respond to growing social demands by increasing expenditure on wages and salaries, which rose dramatically in most oil exporters in recent years.
Although many of the oil exporters have accumulated reserves to withstand short-run oil price volatility, a sustained drop in oil prices resulting from a further slowdown in global economic activity remains a risk to guard against. For example, a 10 percent drop in oil prices would bring down the oil exporters’ combined current surplus by about $150 billion. Stepped-up spending has increased the vulnerability to oil price declines in case of further deterioration in the global economy.
“Looking ahead, the main issue facing Middle East oil exporters is how to take advantage of their current positive position to strengthen their resilience against oil price declines and diversify their economies to boost private-sector job creation,” Ahmed said. “Fiscal policy could gradually shift to bolstering national savings, and countries could ease the pace of government spending, especially on expenditures that are hard to reverse, like public-sector hiring,” he added.

Oil importers remain under strain
The tepid growth witnessed in 2011 in the region’s oil-importing countries persists. A moderate economic recovery is expected in 2013, but is subject to heightened downside risks. For the Arab countries in transition, ongoing political transitions also weigh on growth. With uncertainty over the medium-term policy agendas in many countries, investors are holding back.
At the same time, international food and fuel prices have continued to rise, and economic activity in trading partners—most notably in Europe, with which many oil importers have important economic links—has deteriorated. In addition, tourism arrivals are recovering only slowly from the large decline in 2011, and foreign direct investment inflows remain subdued.
As a result, oil-importing countries continue to face an economic slowdown in 2012, with growth of about 2 percent. For 2013, a recovery to about 3¼ percent growth is foreseen—a rate far below what is required to address chronic and growing unemployment.

Stabilization and growth
In response to social demands and rising food and fuel prices, governments in the Arab countries in transition have significantly expanded spending on subsidies. Budget revenues have also fallen, with the consequence that fiscal balances have deteriorated.
With average public debt at more than 70 percent of GDP, fiscal vulnerabilities are high, and any significant fiscal slippages, slower-than-projected growth, or higher interest rates could put debt on an unsustainable path. At the same time, external current account deficits have widened from already high levels. Together with weak capital inflows, these have resulted in a sharp decline in official international reserves.
Stronger growth is urgently needed to spur job creation and provide the population with tangible benefits. To that end, it is important that governments in the Arab countries in transition embark on policies to restore macroeconomic sustainability and structural reforms aimed at improving competitiveness.
“With fiscal pressures continuing to build, there is a growing urgency to act on macroeconomic stabilization. But it is equally important that both stabilization measures and the design of structural reforms are done in a way that minimizes adverse impacts on the poor and vulnerable,” Ahmed stressed. This effort, he added, clearly lies with the countries themselves and will need to be supported by the international community through finance, technical support, and better access to export markets.
| Middle East, North Africa, Afghanistan, and Pakistan (MENAP) Selected Economic Indicators | ||||||||||
| (Percent of GDP, unless otherwise indicated) | ||||||||||
| Average | Projections | |||||||||
| 2000–06 | 2007 | 2008 | 2009 | 2010 | 2011 | 2012 | 2013 | |||
|
MENAP1 |
||||||||||
|
Real GDP (annual growth) |
5.4 | 5.8 | 4.4 | 2.6 | 4.8 | 3.3 | 5.1 | 3.6 | ||
|
Current Account Balance |
9.2 | 13.1 | 13.7 | 2.0 | 7.0 | 13.2 | 11.2 | 9.7 | ||
|
Overall Fiscal Balance |
3.1 | 6.2 | 6.6 | -3.0 | -0.4 | 1.5 | 1.5 | 0.4 | ||
|
Inflation, p.a. (annual growth) |
5.9 | 9.9 | 14.3 | 7.3 | 7.3 | 10.3 | 10.9 | 9.5 | ||
|
MENAP oil exporters |
||||||||||
|
Real GDP (annual growth) |
5.8 | 5.3 | 4.0 | 1.7 | 5.3 | 3.9 | 6.6 | 3.8 | ||
|
Current Account Balance |
13.4 | 18.6 | 19.7 | 4.8 | 11.0 | 18.7 | 16.4 | 14.2 | ||
|
Overall Fiscal Balance |
7.4 | 12.4 | 13.3 | -1.8 | 2.5 | 5.9 | 6.1 | 4.4 | ||
|
Inflation, p.a. (annual growth) |
6.7 | 11.5 | 15.0 | 5.7 | 6.6 | 10.4 | 11.5 | 9.7 | ||
|
Of which: Gulf Cooperation Council |
||||||||||
|
Real GDP (annual growth) |
5.7 | 5.3 | 6.3 | -0.2 | 5.5 | 7.5 | 5.5 | 3.7 | ||
|
Current Account Balance |
15.4 | 19.9 | 22.7 | 7.5 | 14.4 | 24.1 | 23.6 | 21.1 | ||
|
Overall Fiscal Balance |
11.5 | 17.9 | 24.8 | -0.7 | 4.5 | 12.7 | 14.6 | 11.2 | ||
|
Inflation, p.a. (annual growth) |
1.6 | 6.6 | 11.0 | 3.0 | 3.2 | 3.6 | 3.5 | 3.6 | ||
|
MENAP oil importers |
||||||||||
|
Real GDP (annual growth) |
4.9 | 6.8 | 5.3 | 4.2 | 4.0 | 2.0 | 2.1 | 3.3 | ||
|
Current Account Balance |
-0.8 | -2.5 | -4.1 | -4.8 | -3.1 | -3.5 | -5.2 | -4.4 | ||
|
Overall Fiscal Balance |
-4.5 | -5.2 | -5.6 | -5.0 | -5.6 | -7.0 | -7.8 | -7.4 | ||
|
Inflation, p.a. (annual growth) |
4.5 | 7.1 | 13.0 | 10.2 | 8.5 | 9.9 | 9.7 | 9.2 | ||
|
MENA1 |
||||||||||
|
Real GDP (annual growth) |
5.5 | 5.7 | 4.5 | 2.6 | 5.0 | 3.3 | 5.3 | 3.6 | ||
|
Current Account Balance |
10.0 | 14.5 | 15.3 | 2.6 | 7.7 | 14.2 | 12.2 | 10.6 | ||
|
Overall Fiscal Balance |
3.9 | 7.7 | 8.4 | -2.8 | 0.2 | 2.5 | 2.5 | 1.4 | ||
|
Inflation, p.a. (annual growth) |
5.9 | 10.2 | 14.6 | 6.2 | 7.0 | 9.8 | 10.9 | 9.5 | ||
|
MENA oil importers |
||||||||||
|
Real GDP (annual growth) |
4.7 | 6.7 | 6.1 | 4.9 | 4.3 | 1.4 | 1.2 | 3.3 | ||
|
Current Account Balance |
-1.3 | -1.8 | -2.8 | -4.6 | -3.6 | -5.2 | -6.9 | -5.8 | ||
|
Overall Fiscal Balance |
-5.3 | -5.1 | -4.8 | -5.2 | -5.6 | -7.5 | -8.7 | -7.7 | ||
|
Inflation, p.a. (annual growth) |
4.2 | 6.7 | 13.6 | 7.3 | 8.0 | 7.9 | 9.0 | 8.8 | ||
|
Memorandum |
||||||||||
|
Arab countries in transition (excl. Libya) |
||||||||||
|
Real GDP (annual growth) |
4.6 | 6.0 | 6.3 | 4.5 | 4.7 | 1.2 | 2.0 | 3.6 | ||
|
Current Account Balance |
1.1 | -1.1 | -2.5 | -3.9 | -3.3 | -4.9 | -5.4 | -4.6 | ||
|
Overall Fiscal Balance |
-5.2 | -5.5 | -5.2 | -5.7 | -6.0 | -8.0 | -9.1 | -8.0 | ||
|
Inflation, p.a. (percent) |
4.7 | 7.1 | 14.0 | 7.7 | 8.4 | 7.9 | 7.8 | 8.6 | ||
|
Source: IMF, Middle East and Central Asia Regional Economic Outlook. 12011–13 data exclude Syrian Arab Republic. MENAP: (1) Oil exporters: Algeria, Bahrain, Iran, Iraq, Kuwait, Libya, Oman, Qatar, Saudi Arabia, the United Arab Emirates, and Yemen; (2) Oil importers: Afghanistan, Djibouti, Egypt, Jordan, Lebanon, Mauritania, Morocco, Pakistan, Sudan, Syria, and Tunisia; (3) Arab countries in transition: Egypt, Jordan, Libya, Morocco, Tunisia, and Yemen. MENA: MENAP excluding Afghanistan and Pakistan. Note: Data refer to the fiscal year for the following countries: Afghanistan and Iran (March 21/March 20), Qatar (April/March), and Egypt and Pakistan (July/June). | ||||||||||
| |||||||||||||||||||||||||||||||||||||||||||||||||||||||||||||||||||||||||||||||||||||||||||||||||||||||||||||||||||||||||||||||||||||||||||||||||||||||||||||||||||||||||||||||||||||||||||||||||||||||||||||||||||||||||||||||||||||||||||||||||||||||||||||||||||||||||||||||||||||||||||||||||||||||||||||||||||||||||||||||||||||||||||||||||||||||||||||||||||||||||||||||||||||||||||||||||||||||||||||||||||||||||||||||||||||||||||||||||||||||||||||||||||||||||||||||||||||||||||||||||||||||||||||||||||||||||||||||||||||||||||||||||||||||
IMF EXTERNAL RELATIONS DEPARTMENT
| Public Affairs | Media Relations | |||
|---|---|---|---|---|
| E-mail: | publicaffairs@imf.org | E-mail: | media@imf.org | |
| Fax: | 202-623-6220 | Phone: | 202-623-7100 | |


