


Middle East and Central Asia
Regional Economic Outlook Update: Middle East and Central Asia
May 2018
CCA Full Text
Аймақтық экономикалық болжам Жаңарту
Growth is improving in the Middle East, North Africa, Afghanistan, and Pakistan (MENAP) region and was stronger than expected last year in the Caucasus and Central Asia (CCA) region. However, the regions are not fully benefitting from the stronger global outlook.
In MENAP, the fragile recovery requires further reforms that will help diversify economies, create jobs, and secure resilience.
Meanwhile, the growth momentum in the CCA is temporary, which is why action is needed now to spur private-sector development, so that the region avoids a new reality of low growth.
MENAP and Global Developments: Implications for the Middle East, North Africa, Afghanistan and Pakistan Region
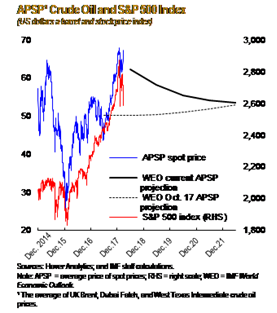
Global growth continued to strengthen in the second half of 2017 and is now estimated at 3.8 percent for the full year, the highest level since 2011 and 0.2 percentage point stronger than forecast in the October 2017 World Economic Outlook (see table). Growth is projected to strengthen further to 3.9 percent in 2018 and in 2019, also 0.2 percentage point higher than anticipated in October. Stronger prospects for the euro area should benefit the Middle East, North Africa, Afghanistan, and Pakistan (MENAP) region, especially oil importers, through higher exports. The region should also benefit from a marginal strengthening of the outlook for China, a key partner for the region. However, the global outlook also entails higher global interest rates as monetary policy continues to normalize in advanced economies. This could increase fiscal vulnerabilities and tighten credit conditions in the MENAP region, especially if the risk that global financial conditions tighten more than expected materializes.
 In addition to the risk of
tighter financial conditions, escalating import tariffs or a shift toward
inward-looking policies could harm international trade, reduce global
growth, and dampen commodity prices. And the region continues to be exposed
to the risk of worsening geopolitical tensions and conflicts.
In addition to the risk of
tighter financial conditions, escalating import tariffs or a shift toward
inward-looking policies could harm international trade, reduce global
growth, and dampen commodity prices. And the region continues to be exposed
to the risk of worsening geopolitical tensions and conflicts. 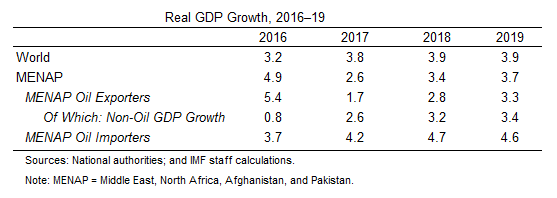
MENAP Oil-Exporting Countries: Time to Accelerate Reforms
Economic growth in oil exporters in the Middle East, North Africa, Afghanistan, and Pakistan (MENAP) bottomed out in 2017 and is expected to accelerate in 2018–19. This largely reflects the continued recovery in non-oil activity as many countries are slowing the pace of fiscal consolidation in support of domestic demand. Risks to the outlook are skewed to the downside. These include the possibility of a sharp tightening of global financial conditions, growing trade tensions, and geopolitical strains—while the outlook for oil prices remains subdued and highly uncertain. If these risks materialize, they could trigger potentially significant fiscal and financing pressures for many countries in the region, affecting prospects for continued fiscal consolidation and economic recovery. Weak growth prospects over the medium term underscore the importance of accelerating planned structural reforms.
MENAP Oil-Importing Countries: Risks to the Recovery Persist
The growth recovery in the Middle East, North Africa, Afghanistan, and Pakistan (MENAP) oil‑importing countries is set to continue in 2018, lifted by gains from ongoing reforms, improved domestic confidence in some countries, and a steady upswing in external demand. While the outlook remains broadly positive, with a moderate uptick in economic activity projected for 2019, it has softened for most countries relative to the forecast in the October 2017 Regional Economic Outlook, and risks remain skewed to the downside. In addition, growth is expected to remain too low to provide enough jobs for the expanding labor force. Generating broad-based growth that benefits all will require an acceleration of structural reforms that improve the business climate and boost productivity. The need for sustained fiscal consolidation that protects much-needed social spending and investment while ensuring stability also persists.
CCA and Global Developments: Implications for the Caucasus and Central Asia Region
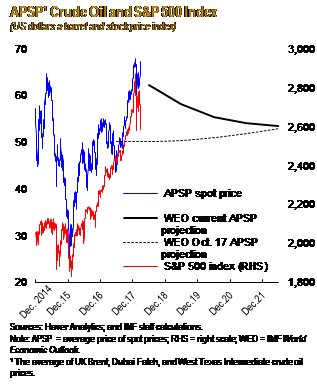
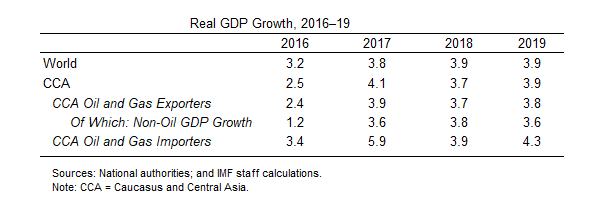
Global growth continued to strengthen in the second half of 2017 and is now estimated at 3.8 percent for the full year, the highest level since 2011 and 0.2 percentage point stronger than forecast in the October 2017 World Economic Outlook (see table). Growth is projected to strengthen further to 3.9 percent in 2018 and 2019, also 0.2 percentage point higher than anticipated in October. In particular, Russia, an important source of trade and remittance flows for countries in the Caucasus and Central Asia (CCA) region, returned to positive growth in 2017, and its economy is projected to expand by 1.7 percent this year, slightly higher than projected in October, before moderating to 1.5 percent in 2019. The region should also benefit from the marginal strengthening of the outlook for China , a key partner for the region. However, the global outlook also entails higher interest rates as monetary policy continues to normalize in advanced economies. This could tighten credit conditions in the CCA region.
Caucasus and Central Asia: A Need to Capitalize on the Current Growth Momentum
Кавказ және Орталық Азия: Ағымдағы өсім қарқынын капиталдандыру қажеттілігі
Economic growth in the Caucasus and Central Asia (CCA) region exceeded expectations in 2017, in part due to stronger oil prices, remittances, and external demand, which are not expected to be sufficient, however, to maintain this growth momentum in 2018–19. Growth is projected to stabilize in the medium term around levels that are below the average reached in the first decade of this century. To avoid a new reality of subdued growth, a more deliberate push toward a private-sector-led growth model is needed now. That would enable countries to effectively leverage the opportunities created by the current rebound in global activity and the prospect of closer regional and global integration. In addition to preserving macroeconomic stability, including by addressing fiscal and financial sector challenges, countries therefore need to make further progress on structural reforms.Statistical Appendix
The IMF’s Middle East and Central Asia Department (MCD) countries and territories comprise Afghanistan, Algeria, Armenia, Azerbaijan, Bahrain, Djibouti, Egypt, Georgia, Iran, Iraq, Jordan, Kazakhstan, Kuwait, the Kyrgyz Republic, Lebanon, Libya, Mauritania, Morocco, Oman, Pakistan, Qatar, Saudi Arabia, Somalia, Sudan, Syria, Tajikistan, Tunisia, Turkmenistan, the United Arab Emirates, Uzbekistan, the West Bank and Gaza, and Yemen.
The following statistical appendix tables contain data for 31 MCD countries. Data revisions reflect changes in methodology and/or revisions provided by country authorities.