


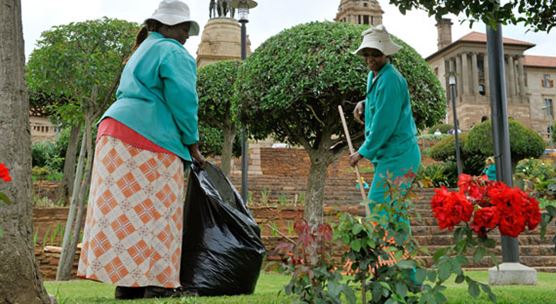
Gardeners tending the lawn at the seat of government in the capital Pretoria. The authorities have used different tools to tackle stubborn levels of inequality (photo: Gero Breloer/picture-alliance/dpa/Newscom)
Six Charts Explain South Africa's Inequality
January 30, 2020
South Africa suffers among the highest levels of inequality in the world when measured by the commonly used Gini index. Inequality manifests itself through a skewed income distribution, unequal access to opportunities, and regional disparities. Low growth and rising unemployment have contributed to the persistence of inequality.
Related Links
The South African government has used different tools to tackle the stubborn levels of inequality that have plagued the country, including through progressive fiscal redistribution.
Efforts to reduce inequality have focused on higher social spending, targeted government transfers, and affirmative action to diversify wealth ownership and promote entrepreneurship among the previously marginalized. These measures need to be complemented with reforms that promote private investment, jobs, and inclusive growth.
Here are six charts that tell the story of South Africa's inequality:
-
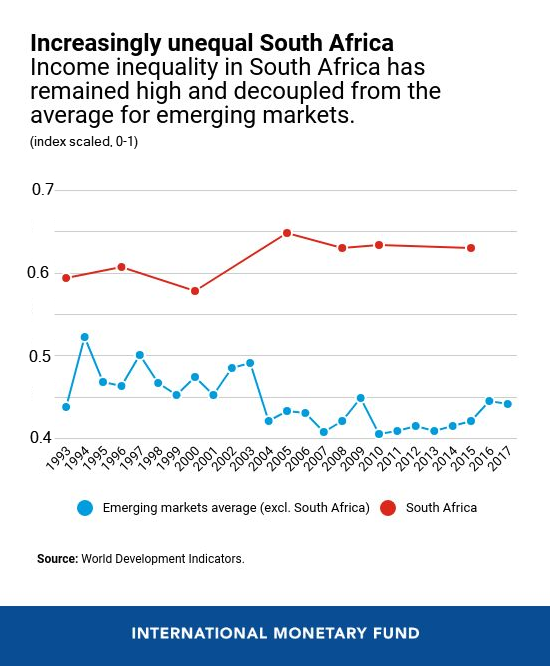
Inequality has remained stubbornly high.
South Africa started the 1990s with already elevated inequality as the
policy of apartheid excluded a large swath of the population from
economic opportunities. South Africa’s Gini—an index that measures
inequality—has increased further in the early 2000s and has remained
high ever since. Meanwhile, its peers have been able to make inroads in
reducing inequality.
-
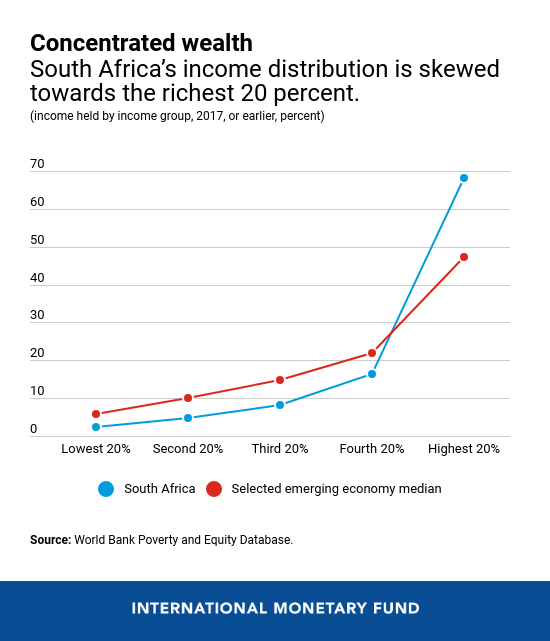
Income distribution remains highly skewed.
The top 20 percent of the population holds over 68 percent of income
(compared to a median of 47 percent for similar emerging markets). The
bottom 40 percent of the population holds 7 percent of income (compared
to 16 percent for other emerging markets). Similar trends can be
observed across other measures, such as the income share of the top 1
percent.
-
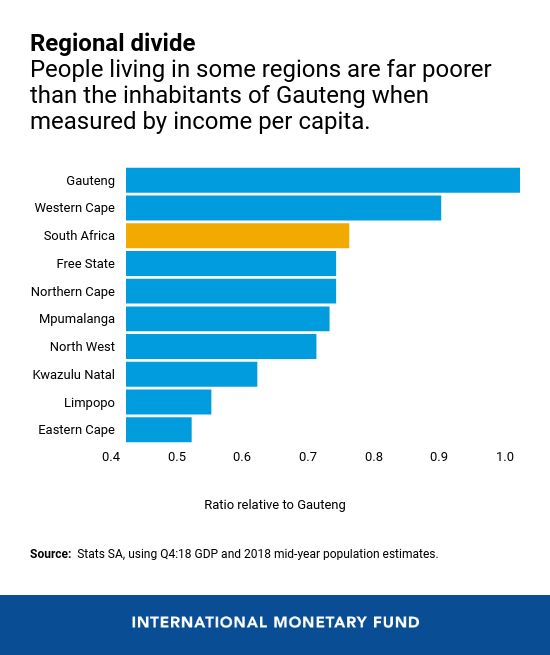
Significant disparities remain across regions.
Income per capita in Gauteng—the main economic province that comprises
large cities like Johannesburg and Pretoria—is almost twice the levels
as that found in the mostly rural provinces like Limpopo and Eastern
Cape. Being close to the economic centers increases job and income
prospects.
-
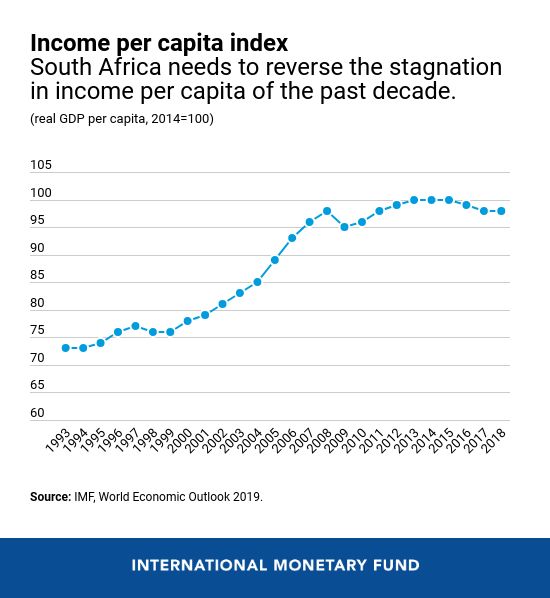
Subdued growth has jeopardized efforts to promote inclusion.
With growth stagnating over the past decade, the economy has not
created enough jobs to absorb the unemployed and new entrants to the
labor market. Broad-based growth that generates more low-skilled jobs
for the unemployed will support inequality reduction.
-
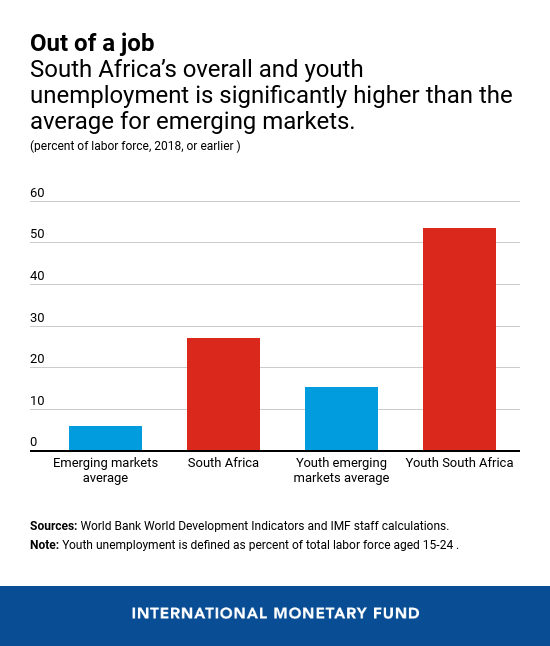
High unemployment is a major factor behind the inequality
levels. South Africa's unemployment rate is significantly higher than in other emerging
markets, with youth unemployment exceeding 50 percent. Creating more
low-skilled jobs to improve labor force participation, especially in
the poorest provinces, will spur inclusion. Employment prospects can be
enhanced by improving the quality of education and facilitating
affordable transportation to job centers.
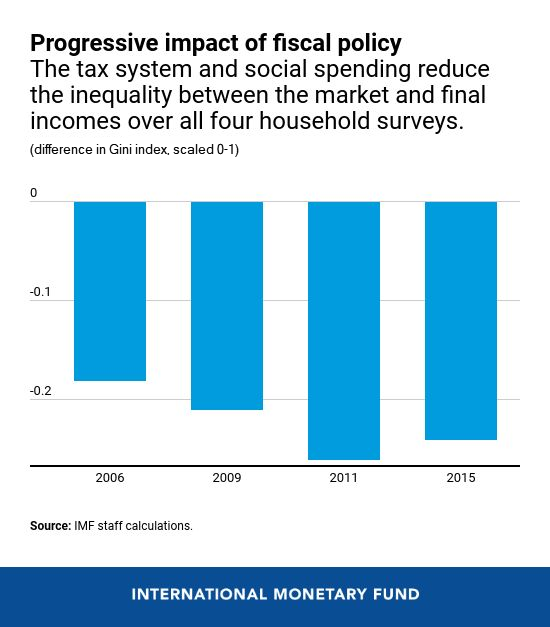
- Fiscal policy has been used effectively to reduce inequality. Currently, a slightly progressive tax system and effective social safety net reduce overall inequality (relative to the market income). South Africa's high debt level has reduced the government's scope to further leverage fiscal policy as a redistributive tool.
In the future, South Africa will need further fundamental reforms for more robust and inclusive growth. The focus needs to be on creating a business environment more conducive to private investment and job creation. This requires improved governance, reducing the cost of doing business, making goods and services markets more open to competition, allowing firms to compensate workers in line with their skills and productivity, and making state-owned service providers more efficient.
Policies will also be needed to create opportunities to support the marginalized population through improved quality of education, health, and transportation.