
Hidden Value
Finance & Development, September 2016, Vol. 53, No. 3
Edward F. Buffie, Michele Andreolli, Bin Grace Li, and Luis-Felipe Zanna

Public-private partnerships have been criticized as too costly, but when the whole economic picture is considered, they look much better
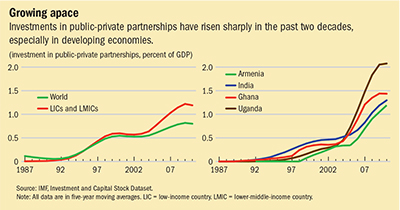
Public-private partnerships to build and operate infrastructure assets are increasingly common in less developed economies (see chart). But they are also highly controversial. Case studies warn that public-private partnerships may be much more expensive than traditional procurement in which public agencies build infrastructure assets on their own (or outsource construction to a private supplier). Traditional procurement is commonly called own investment by the public sector.
The list of extra expenses incurred in public-private partnerships is quite long:
- The partnerships assign construction risk to the private partner to exploit the tight relationships between asset construction, quality of services, and the revenue the partner earns after operations commence—frequent blackouts, for example, reduce sales at poorly built power plants. But the private sector cannot spread risk as widely as the public sector; consequently, the return paid to the private partner is usually several points above the interest rate on government debt.
- The administrative costs of writing and tendering bids for complicated long-term contracts are often substantial, while limited competition and the difficulty of designing auctions that prevent collusive behavior are apt to result in inflated bid prices.
- Complex contracts, the impossibility of enumerating all contingencies in partnerships that last 20 to 30 years, and cumbersome legal systems often lead to repeated, costly renegotiations of the original contract.
- Even if the government bargains exceptionally well and minimizes bid, tendering, and renegotiation costs, it cannot avoid the extra cost of monitoring compliance by the private partner.
Half a picture
But the comparison of costs presents only half of the picture. The other half contains everything the private partner brings to the table: superior technical expertise, greater implementation capacity, and less pressure to meet political objectives—such as hiring more workers than needed and purchasing from favored suppliers—that hinder efficiency (de Bettignies and Ross, 2004; Valila, 2005; Grimsey and Lewis, 2005). These advantages translate into shorter construction time (Monteiro, 2005; Sarmento, 2010) and better, more productive infrastructure—power plants that supply electricity without spikes and frequent blackouts, roads that are usable year-round, and ports where cargo can be loaded and unloaded quickly. The critical issue is whether the gains in speed and efficiency compensate for the higher cost. In the language favored by government bureaucrats, do public-private partnerships offer enough “value for the money”? More precisely, do such partnerships offer better value for money than own investment by the public sector?
Typically, policymakers answer this question by calculating the direct return in the two investment programs. The direct return is simply the return on infrastructure (the increase in real GDP, holding other inputs constant, divided by the capital cost of the project) minus either the return paid to the private partner (including transaction and administrative costs) or the interest rate paid on external debt. In a head-to-head matchup, the comparison of direct returns often picks own investment as the winner—the higher-quality infrastructure available in the public-private partnership is not worth the extra cost.
The direct return is easy to understand and easy to calculate. For two reasons, however, it is rarely an accurate predictor of relative social returns. First, higher on-time completion by public-private partnerships is a big plus in low-income countries plagued by acute bottlenecks in transportation, power, telecommunications, and irrigation. When projects pay a 25 percent return and can be financed at 10 percent, it is best to complete them as fast as possible. Second, in most investment programs, the government aims not only to improve the country’s infrastructure but also to stimulate private investment and to reduce unemployment, underemployment, and poverty. When these additional objectives are taken into account, the social returns to public-private partnerships and own investment diverge dramatically. (The social return is the increase in national income adjusted to reflect the value policymakers place on poverty reduction.) Because public-private partnerships generally build better, higher-quality infrastructure than own investment, they raise the return on private capital more and increase the demand for labor more. Consequently, if the difference in costs is not too great, public-private partnerships are preferable because they are more effective in reducing underinvestment, unemployment, and poverty.
Choosing the right approach
But it is difficult for policymakers to assess whether the social returns from faster construction and better-quality infrastructure outweigh the higher costs of public-private partnerships.
We built a dynamic macroeconomic model that helps them do that. The model tracks the interactions between public investment in infrastructure, private capital accumulation, unemployment, and real wages. Growth in the stock of infrastructure—whether an airport, a power plant, or an irrigation project—raises social welfare directly by increasing total factor productivity (the rise in output not directly attributable to increases in inputs such as labor and capital) and indirectly by stimulating private investment and creating more and better jobs. The model uses empirical estimates for developing economies to determine the impact of infrastructure on total factor productivity and how much the real wage rises when unemployment falls.
Welfare depends on consumption today, tomorrow, and in the distant future. To measure the overall welfare gain, we calculate the permanent increase in consumption that yields the same increase in welfare as the actual path of consumption in the investment program. A welfare gain of 10 percent, for example, means that the fluctuating path of consumption in the investment program increases welfare by the same amount as a permanent increase in consumption of 10 percent starting today.
Policymakers must determine the point at which the welfare gain from the public-private partnership exceeds that of own investment. The break-even point depends on numerous factors, including policymakers’ social objectives.
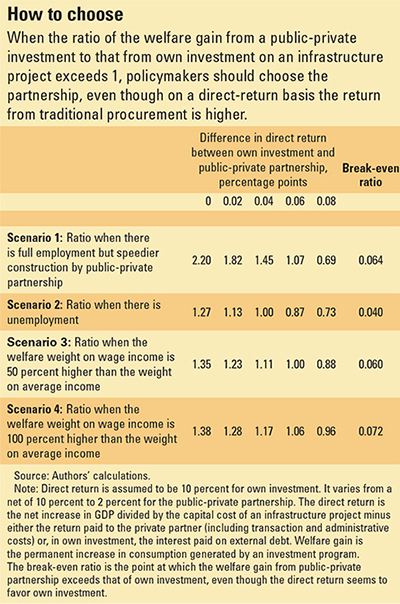
The table illustrates how the model can help policymakers make the right choice. It shows the welfare gain from public-private partnership divided by the welfare gain from own investment under alternative assumptions about the labor market, the speed of construction, and the importance of wage income relative to increases in income per capita. In the case of own investment, we assumed that the government borrows in the Eurobond market at 6 percent and that infrastructure earns a return of 16 percent. The direct return, then, is 10 percent for all own investment.
In the competing public-private partnership, the borrowing rate—the annual return paid to the private partner plus all transaction and administrative costs—is 15 percent, while the return on infrastructure ranges from 17 percent to 25 percent. The corresponding range for the direct return, then, is 2 percent to 10 percent. With own investment assumed to return 10 percent, the comparison of direct returns alone strongly favors own investment: the direct return gap, the difference between the direct return from own investment and the direct return from the public-private partnership, ranges from zero—when the direct return from both is 10 percent—to as high as 8 percentage points—when the direct return from public-private partnerships is 2 percent. The case for choosing public-private partnerships over own investment therefore rests entirely on more favorable effects on completion time, private investment, job growth, and real wages that offset its lower direct return.
Several scenarios
The table reports results for four different scenarios. In the first, there is full employment but investment projects in the public-private partnership reach the 50 percent completion point in 25 percent less time than own-investment projects. The other three scenarios assume the same speed of construction in public-private partnerships and traditional procurement, but allow for unemployment and different welfare weights for wage income and average income. In the unemployment scenario, the government ignores effects on income distribution; in the third and fourth scenarios, it values a dollar increase in wage income 50 to 100 percent more than a dollar increase in average household income.
What is striking is that many of the ratios exceed 1, meaning that public-private investment increases social welfare more than own investment, even when the direct-return gap is large. Faster construction speed alone increases the break-even value of the direct-return gap—that is, the point at which a government would have no preference between investment approaches—from zero (the value in the comparison of direct returns when both return 10 percent) to 6.4 percentage points. In other words, a public-private partnership with a direct return greater than 3.6 percent generates a larger welfare gain than own investment with a direct return of 10 percent, once the difference in speed of construction is taken into account.
In the model with unemployment and the same speed of construction, the break-even value ranges from 4 to 7.2 percentage points depending on the weight of wage income relative to average income.
The lesson is that policymakers ought to look beyond direct returns when evaluating the merits of public-private partnerships versus own investment. Public-private partnerships are undeniably expensive. But they are competitive with traditional procurement if they enable the public sector to build infrastructure faster and of higher quality. A public-private partnership that pays a modest direct return of 2 to 5 percent may generate a higher social return than own investment that pays a direct return of 10 percent. ■
Edward F. Buffie is a Professor of Economics at Indiana University Bloomington. Michele Andreolli is a Research Officer, Bin Grace Li is an Economist, and Luis-Felipe Zanna is a Senior Economist, all in the IMF’s Research Department.
This article is based on the authors’ 2016 IMF Working Paper, No. 16/78, “Macroeconomic Dimensions of Public-Private Partnerships.”
References
de Bettignies, Jean-Etienne, and Thomas W. Ross, 2004, “The Economics of Public-Private Partnerships,” Canadian Public Policy, Vol. 30, No. 2, pp. 135–54.
Grimsey, Darrin, and Mervyn K. Lewis, 2005, “Are Public Private Partnerships Value for Money? Evaluating Alternative Approaches and Comparing Academic and Practitioner Views,” Accounting Forum, Vol. 29, No. 4, pp. 345–78.
Monteiro, Rui Sousa, 2005, “Public-Private Partnerships: Some Lessons from Portugal,” EIB Papers, Vol. 10, No. 2, pp. 73–81.
Sarmento, Joaquim Miranda, 2010, “Do Public Private Partnerships Create Value for Money for the Public Sector? The Portuguese Experience,” OECD Journal on Budgeting, Vol. 2010, No. 1, pp. 1–27.
Valila, Timo, 2005, “How Expensive Are Cost Savings? On the Economics of Public-Private Partnerships,” EIB Papers, Vol. 10, No. 1, pp. 95–119.
Opinions expressed in articles and other materials are those of the authors; they do not necessarily reflect IMF policy.

Write to us
F&D welcomes comments and brief letters, a selection of which are posted under Letters to the Editor. Letters may be edited. Please send your letters to fanddletters@imf.org