
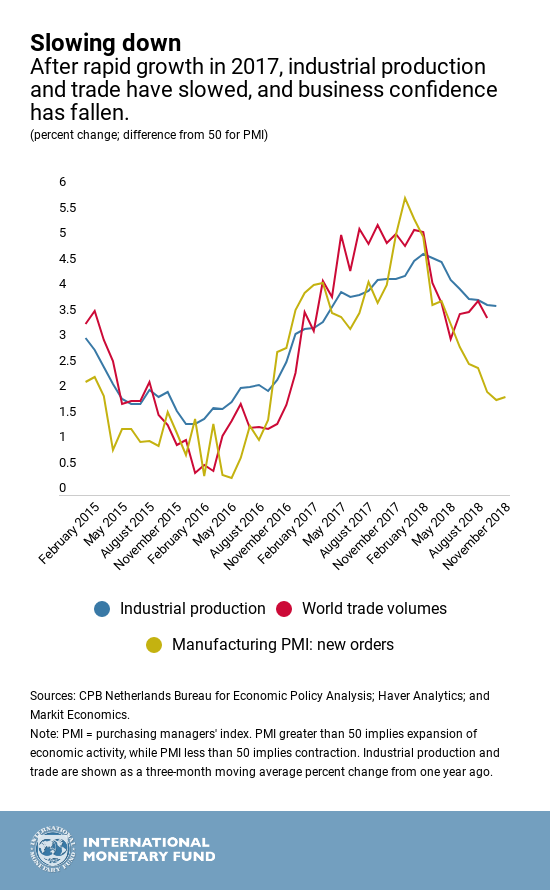
The global economy started 2018 on an upbeat note, buoyed by a pickup in global manufacturing and trade through 2017. As investors’ confidence in the global economic outlook lost steam, so did the upswing.
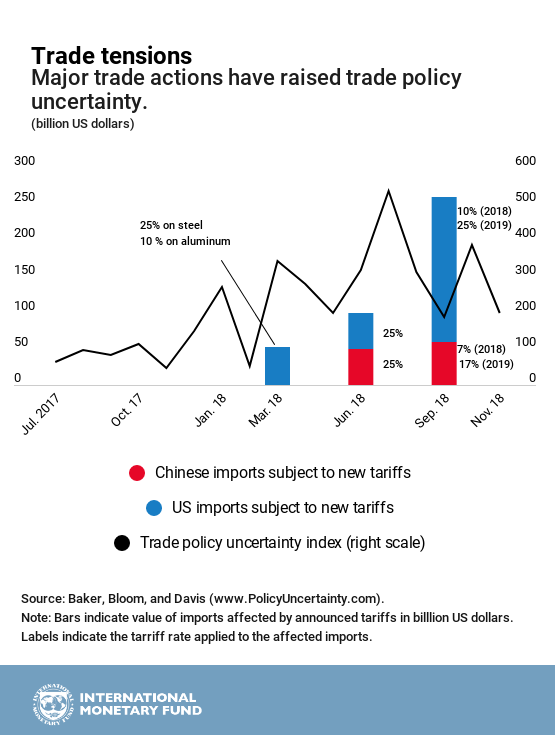
2. One reason behind this loss in momentum is the implementation of tariffs by major economies—especially the United States—and retaliatory measures taken by others, including China. The increasingly protectionist rhetoric on trade has meant higher uncertainty about trade policy, which weighs on future investment decisions.
3. Despite these actions, the US economy expanded at a fast pace in 2018, as tax cuts and spending increases stimulated demand. The US Federal Reserve has continued to raise the policy interest rate as a result. Interest rates on US long-term bonds have increased less, as investors see risks to future growth and value the safety of US Treasury securities. 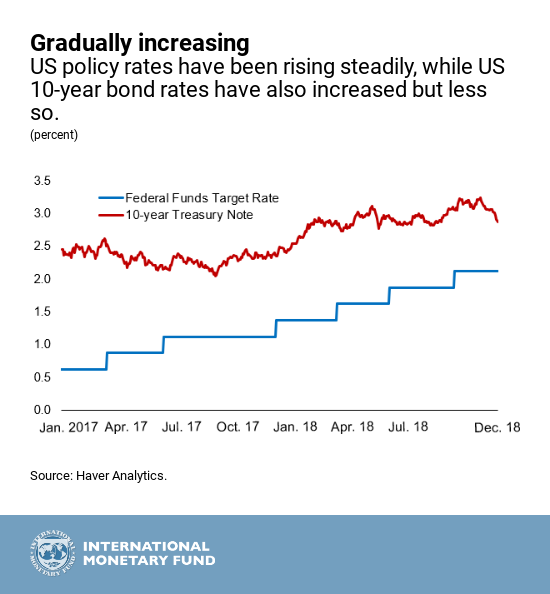
4. As growth and interest rates in the United States have outpaced those in other major economies, the US dollar has appreciated against most other currencies in 2018.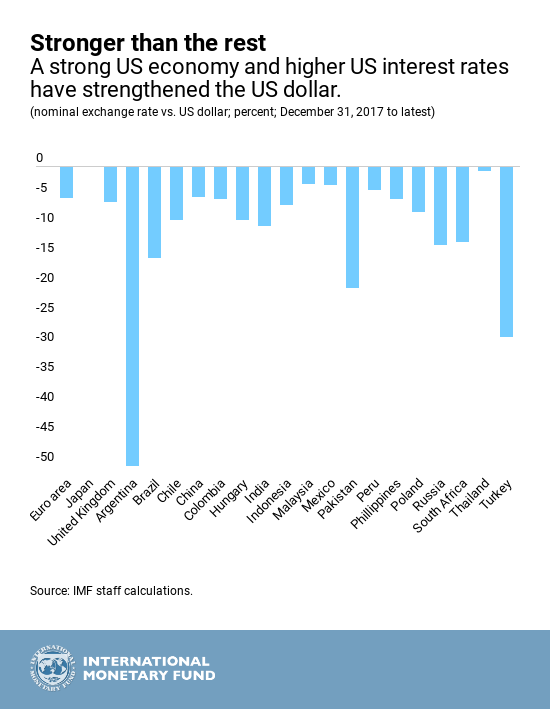
5. Some vulnerable emerging market economies have come under strain as the US dollar gained value and the level of risk that global financial investors were prepared to accept dropped. Most of these countries have seen increases in their external borrowing costs, but the extent of these increases varied widely.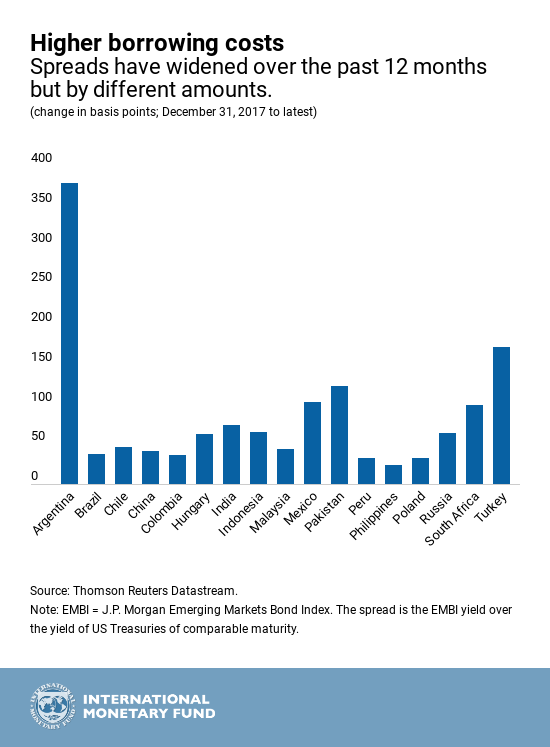
How will the global economy fare in 2019? Stay tuned until January 21, when the World Economic Outlook Update will present the IMF’s view on where the global economy is headed.


