
Hollowing Out
Finance & Development, December 2016, Vol. 53, No. 4

The U.S. middle class is shrinking as households climb into higher, or slip into lower, income brackets
The U.S. middle class—households with 50 to 150 percent of the national median pretax real income—has been shrinking. Middle-income households declined by 11 percentage points (from 58 to 47 percent) of the total U.S. household population between 1970 and 2014. In other words, the U.S. income distribution has been polarizing, or hollowing out, as middle-income households became richer or poorer (see Chart 1).
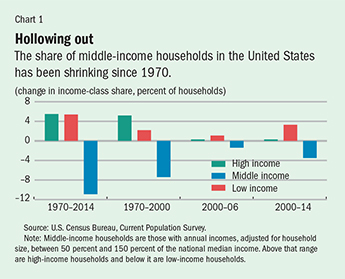
From 1970 to 2000, this polarization was mainly good news because more households moved into upper-income ranks (with real, or after-inflation, incomes higher than 150 percent of the median) than slipped down to real incomes less than 50 percent of the median. Since 2000, however, the story has reversed. More middle-income households have fallen into lower-income than have risen into higher-income brackets.
Falling into a lower-income bracket takes a toll on households, especially at a time when average real incomes have been broadly stagnating. This hollowing out has damaged the economy in recent years by hampering consumption—the main engine of U.S. growth. Lower consumption in the world’s largest economy also hurts its trading partners, as well as many other countries indirectly tied to the U.S. economy through global production and financial chains.
Middle-class trends
A strong economy needs strong consumption and investment to function well. Low-income households have limited ability to consume and save little. High-income households save a lot but, relative to their incomes, consume too little. Middle-income households provide a reliable balance for consumption and saving in a society. In the United States, the middle class not only accounts for most of the economy’s consumption, it also provides most of its human capital and owns most of its physical capital, such as houses and cars. So a shrinking middle class hurts the economy.
The 11 percentage point shift in the middle-class share of total U.S. households since 1970 represents, in part, economic progress; roughly half of these households advanced up through the income distribution, while the other half moved down over that span. But the long-term trend masks a deterioration since the turn of the century. While the majority of middle-income households that left the middle ranks moved up between 1970 and 2000, since 2000 only 0.25 percent of households have risen to higher-income ranks, compared with an astonishing 3.25 percent of households that have moved down the income ladder from middle- to low-income status.
Income share is a proxy for an income group’s relative weight in the economy. At the same time the middle class is hollowing out, its share of total national income is shrinking. The income share of middle-income households fell from about 47 percent of total U.S. income in 1970 to about 35 percent in 2014. That decrease in the income of middle-income households corresponds to the increase in the income share garnered by high-income households. Meanwhile, the share for the lower-income households has been flat over the entire period—at about 5 percent of total national income. Low wage growth in recent years—partly a result of the drawn-out recovery from the global financial crisis but also because people weren’t changing jobs—has also contributed to these trends (Danninger, 2016).
Inequality and polarization
Although growing income inequality has been studied extensively by economists, income polarization has not received as much attention. Income polarization measures the move from the middle of the income distribution out into the tails. Income inequality measures how far apart incomes at those tails are—that is, the income distance between the low- and high-income groups.
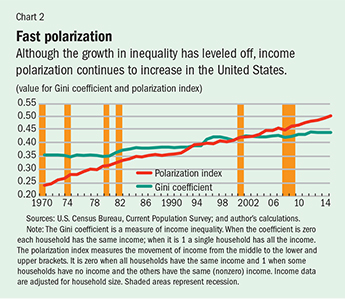
Income inequality is usually measured by the Gini coefficient, which gauges statistical dispersion in household income distribution. A similar index, developed to measure income polarization, is far less well known than the Gini coefficient. This index measures the relative population weight of households whose incomes are close to the extremes (poles) of the distribution. The polarization index varies between zero and 1. It is zero when all households have the same income. It increases as incomes of more households get closer to the two extremes of the income distribution and reaches 1 when some households have no income and the others have the same (nonzero) income. Chart 2 shows that polarization has grown faster than inequality since 1970 based on a comparison of the Gini and polarization indices. Moreover, while the Gini coefficient has been broadly flat since 2000, the polarization index has continued to increase, suggesting that the hollowing out of the middle class in recent years may be socially and economically even more worrisome than inequality.
A broad-based hollowing out
We define the middle class as households whose incomes fall within 50 to 150 percent of median real income, but there are no easily agreed definitions of what constitutes the middle class. Our research shows that the hollowing out of the middle class appears to occur under alternative reasonable assumptions about which upper and lower bands around median income are used to define middle income—for example between 60 and 225 percent or between 75 and 125 percent of median income.
We adopted a relative definition of the middle class in which household incomes each year are compared with the median income of that year. Another definition could use absolute dollar salary cutoffs that are not necessarily the median income. The hollowing-out trends are also similar when absolute levels are used.
In addition, when households in the top 1 percent of the income distribution are excluded and when gauged across age, race, or education level, the results are similar: income polarization has increased substantially over the past four decades. The only exception is households headed by women; in this group polarization decreased somewhat since 1970, although in recent years, households headed by women have also seen increased income polarization.
The economy suffers
When households disproportionately move toward the lower end of the income distribution, as has been happening recently, there may be negative social and political repercussions. This downward move may also, and usually justifiably, be seen as unfair.
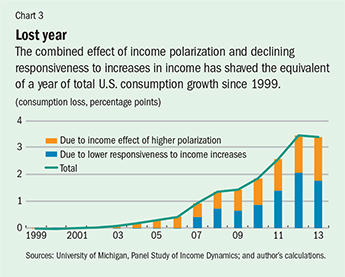
Polarization can also have important consequences for the economy overall. Since 1998, most polarization has involved middle-income households joining the low-income ranks. For the economy as a whole this downward movement has reduced income and resulted in a consumption loss. Polarization is estimated to have led to the equivalent of about half a year of lost consumption growth between 1999 and 2013—a cumulative 1¾ percentage point loss over the period (see Chart 3).
To make matters worse, recent evidence suggests that a similar increase in income for all households does not result in the same increase in consumption it would have triggered not too long ago—to use economists’ jargon, the economy’s marginal propensity to consume has decreased, despite economists’ predictions that it would increase with more low-income households. This has put further downward pressure on consumption. The total consumption lost between 1999 and 2013 due to a lower consumption response to increases in income has also been estimated at about 1¾ percentage points—or the equivalent of an additional half-year of consumption growth.
We can only hypothesize about what has caused the increased polarization and its alarming consequences for the economy overall. Some of it may be due to policies regarding taxation or immigration. Technological progress and declining unionization may also play a role, as well as recessions. Future research should study these and other possible explanations.
Understanding the causes of polarization would help authorities come up with policies to break the pattern, ensure that most people see their standard of living improve over time, and tackle the social and economic consequences of polarization toward the lower end of the income distribution.
Global phenomenon
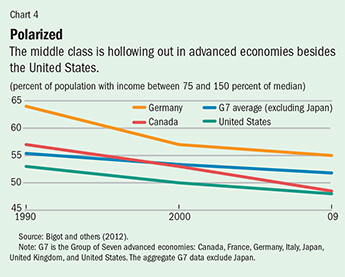
Although this article focuses on income polarization in the United States, hollowing out appears to be occurring in other countries too (see Chart 4). For example, in Canada and Germany, polarization seems more pronounced than in the United States in recent decades, while in France, Italy, and the United Kingdom, it appears to have slowed or decreased (Bigot and others, 2012).
The data for emerging market economies are sparse, but the World Bank regularly calculates the polarization index for many countries, which generally show increased hollowing out over time. For example, the IMF (2006), using World Bank data, found that in all but one of nine Asian countries, polarization grew from the mid-1990s to the mid-2000s. The largest increase in polarization was in China and the smallest in Sri Lanka. Only in Thailand was there a decline during this period.
We studied U.S. data through 2014. But recently released income data show that in 2015 there was impressive broad-based median household income growth of 5¼ percent and a reduction in the poverty rate. However, this strong performance is unlikely to continue in 2016. First, a large proportion of the increase was in unearned income, partly due to higher direct and indirect subsidies under the Affordable Care Act, which increased the availability of health insurance. Such policies result in a one-time jump in income growth that does not continue unless policies change. Second, 2015 was a year of impressive job creation. As the U.S. economy approaches full capacity, job creation is expected to slow. Already through the first half of 2016, monthly payroll job creation was notably lower than in 2015, and average real wage growth decreased too. ■
Ali Alichi is a Senior Economist in the IMF’s Western Hemisphere Department.
This article is based on 2016 IMF Working Paper 16/121, “Income Polarization in the United States,” by Ali Alichi, Kory Kantenga, and Juan Solé.
References
Bigot, Régis, Patricia Croutte, Jörg Muller, and Guillaume Osier, 2012, “The Middle Classes in Europe: Evidence from the LIS Data,” LIS Working Paper Series 580 (Luxembourg Income Study).
Danninger, Stephan, 2016, “What’s Up with U.S. Wage Growth and Job Mobility?” IMF Working Paper 16/122 (Washington: International Monetary Fund).
International Monetary Fund (IMF), 2006, “Rising Inequality and Polarization in Asia,” in Regional Economic Outlook, Asia and Pacific (Washington, September).
Opinions expressed in articles and other materials are those of the authors; they do not necessarily reflect IMF policy.
Photography: Kay Lee Davies/Getty Images.

Write to us
F&D welcomes comments and brief letters, a selection of which are posted under Letters to the Editor. Letters may be edited. Please send your letters to fanddletters@imf.org