
Off Its Pinnacle
Finance & Development, June 2016, Vol. 53, No. 2


Is the United States entering a period of sustained low economic growth?
The average American family of 1870 would have been astounded by the living standards of their 1970 descendants. From electric lighting to healthier and longer life spans, in but a century the American standard of living changed dramatically from the primitive conditions of 1870 to the modern world of today. Those sweeping improvements were in no small way due to technological changes that may never be rivaled for their broad impact on growth, productivity, and well-being.
My recently published book, The Rise and Fall of American Growth, chronicles those changes, examines their sources, and looks at why productivity grew rapidly before 1970 and much more slowly since then. It also forecasts muted growth in productivity and income per person from 2015 to 2040.
The special century
The 100 years after 1870 witnessed an economic revolution in which households were freed from an unremitting daily grind of painful manual labor, household drudgery, darkness, isolation, and early death. In only a century daily life changed beyond recognition. Manual outdoor jobs were replaced by work in air-conditioned environments, housework was increasingly performed by electric appliances, darkness was replaced by light, and isolation was replaced not just by travel, but also by color television images that brought the world into the living room. Most important, a newborn infant could expect to live not to age 45, but to age 72. The economic revolution of 1870 to 1970 was unique in human history.
The foundation of the book’s analysis is that economic growth is not a steady process that creates economic advance at an even, regular pace. Instead, progress occurs much more rapidly in some eras than in others. There was virtually no economic growth for millennia until 1770, only slow growth in the transition century before 1870, and remarkably rapid growth in the century ending in 1970. Growth has been slower since then because some inventions are more important than others. The revolutionary century after the U.S. Civil War was made possible by a unique clustering, in the late 19th century, of “great inventions,” principal among which were electricity and the internal combustion engine.
The first industrial revolution, between 1770 and 1830, witnessed the arrival of the steam engine, railroads, steamships, and mechanized cotton spinning and weaving. The most important industrial revolution was the second, with inventions centered on the period between 1870 and 1940, including not just electricity and the internal combustion engine but also communication and entertainment devices such as the telephone, radio, and motion pictures, as well as chemicals, plastics, antibiotics, and the tools of modern medicine. The second industrial revolution is also notable for its radical improvement in working conditions on the job and at home. The third industrial revolution comprises the digital inventions since 1960, including the mainframe and personal computer, the Internet, and mobile telephones.
The economic growth since 1970 created by the third industrial revolution has been simultaneously dazzling and disappointing. This seeming paradox is resolved when we recognize that advances since 1970 have tended to be channeled into a narrow sphere of human activity involving entertainment, communication, and the collection and processing of information. Technology for processing information evolved from the mainframe to networked personal computers, search engines, and e-commerce. Communication advanced from dependence on landline phones to ever smaller and smarter mobile phones. But for the rest of what humans care about—food, clothing, shelter, transportation, health, and working conditions both inside and outside the home—progress slowed both qualitatively and quantitatively after 1970.
Any consideration of future U.S. economic progress must look beyond the pace of innovation to include the headwinds that are blowing with gale-like force to slow progress. Chief among them is the rise of inequality that since the late 1970s has steadily directed an increasing share of the fruits of U.S. growth to those at the top of the income distribution. Other headwinds include the slowing rate of advance of educational attainment, the drain on economic growth caused by the aging of the population and the retirement of the baby-boom generation, and the fiscal challenge of a rising debt-to-GDP ratio as the old-age income and health programs—Social Security and Medicare—approach insolvency.
Measures and mismeasures of progress
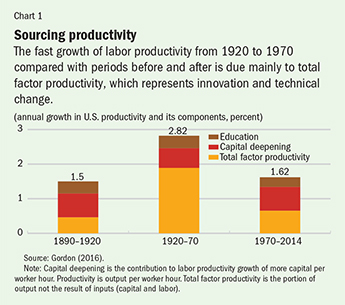
The diminished impact of innovation, due to the narrower scope of the post-1970 inventions, is evident when growth rates of labor productivity and total factor productivity are compared across selected eras of the past 125 years. The growth rate of labor productivity (output per hour) was 2.82 percent a year in the period 1920–70, more than a full percentage point faster than in 1890–1920 or in the period that extends from 1970 to 2014. Each vertical bar in Chart 1 is divided into three parts to break down the contribution to productivity growth of rising educational attainment, the steadily rising amount of capital input per worker hour—usually called capital deepening—and what remains after deducting the contributions of education and capital deepening, total factor productivity (TFP), the best proxy available for the underlying effect of innovation and technological change on economic growth. Because the contributions of education and capital deepening were roughly the same in each of the three time intervals, all of the faster growth of labor productivity between 1920 and 1970 was the result of more rapid innovation and technological change. The margin of superiority of TFP growth in the 1920–70 interval is almost triple the growth rate in the other two periods.
Are these very different TFP growth rates credible? A major theme of my book is that real GDP, the numerator of output per hour, greatly understates the improvement in the standard of living, particularly for the United States in the special 1870–1970 century. First, changes in real GDP omit many dimensions of improvement in the quality of life that matter to people. Second, the price indices used to convert current-dollar spending to constant inflation-adjusted “real” dollars overstate price increases. The improvements in the standard of living that are missed by real GDP data seem to be more important before 1970 than after. Among the more important are the value of clean running water, waste disposal, and the indoor bathroom, not to mention the reduction in infant mortality from 22 percent in 1890 to less than 1 percent after 1950. An explicit allowance for declining infant mortality greatly increases the peaking of TFP growth in the 1929–50 interval, as does an allowance for the greater leisure associated with shorter work hours.
After 1970, real GDP continued to miss the value of advances, but the extent of the mismeasurement declined along with the narrower scope of innovation. And the measurement of price change improved, with the introduction of price indices that adjust for quality changes in information technology equipment. Moreover, in contrast to the era before 1936, when there was no consumer price index (CPI) for automobiles, during the postwar years quality changes in new automobiles were carefully measured by the CPI, including the value of government-mandated antipollution devices.
The third industrial revolution
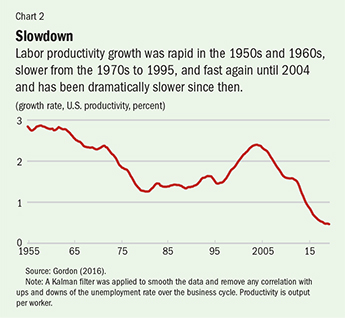
To understand the sources of today’s slow growth, consider the decline in the growth rate of labor productivity since 1955 when a so-called Kalman filter is used to smooth the data and remove any correlation with ups and downs in the unemployment rate over the business cycle (see Chart 2). It shows that after 1955 labor productivity growth proceeded through four stages. It was fast in the 1950s and 1960s, slower from the 1970s to 1995, and fast again in a temporary revival from 1995 to 2004. Since then there has been a precipitous slowdown. The actual rate of productivity growth over the six years ending in 2015 was a mere 0.5 percent a year. Why did the productivity revival of the late 1990s die out so quickly?
Most of the economy realized a one-time benefit from the Internet and Web revolution, but methods of production have changed little since. These major sectors include agriculture, mining, construction, retail trade, transportation, finance, insurance, real estate, professional and business services, education, health, arts and entertainment, accommodation and food services, and government. In each of these sectors, paper-dependent business procedures typical of 1970 had by 2005 been replaced by digitization, and flat screens were everywhere. The revolutions in everyday life made possible by e-commerce and search engines were already well established—Amazon dates to 1994, Google to 1998, and Wikipedia and iTunes to 2001. Facebook was founded in 2004. Will future innovations be sufficiently powerful and widespread to duplicate the brief revival in productivity growth between 1996 and 2004? A look at many of the important economic sectors that experienced that revival suggest that the answer is, “Unlikely.”
Stasis in the office: The digital revolution of 1970–2000 utterly changed the way offices function. In 1970 the electronic calculator had just been invented, but the computer terminal was still in the future. Office work required innumerable clerks to operate the keyboards of electric typewriters that could not download content from the rest of the world. Memory typewriters were just being introduced, so there was still repetitive retyping. By 2000, though, every office was equipped with Web-linked personal computers that could not only perform any word-processing task but could also download multiple varieties of content and perform any type of calculation at blinding speed. By 2005 the introduction of flat screens had completed the transition to the modern office. But then progress stopped. The equipment used in office work and the productivity of office employees closely resemble the office of a decade ago.
Stasis in retailing: Since the development of big-box retailers in the 1980s and 1990s, and the conversion of checkout aisles to bar-code scanners, little has changed in the retail sector. Payment methods have gradually changed from cash and checks to credit and debit cards. In the early years of credit cards in the 1970s and 1980s, checkout clerks had to make voice phone calls for authorization, then terminals that dialed the authorization phone number took over. Now the authorization arrives within seconds. Big-box retailers brought with them many other aspects of the productivity revolution. They transformed supply chains, wholesale distribution, inventory management, pricing, and product selection. But that productivity-enhancing shift from traditional small-scale retailing is largely over. E-commerce raises productivity but still accounts for only about 6 percent of total retail trade (Hortaçsu and Syverson, 2015). The retail productivity gains that are a major accomplishment of the third industrial revolution will be difficult to surpass in the next several decades.
Stasis in finance and banking: The revolution in information and communications technology changed finance and banking along many dimensions—from the humble street-corner ATM to the development of fast trading on the stock exchanges. But both the ATM and billion-share trading days are creations of the 1980s and 1990s. Nothing much has changed since. And despite all those ATMs, the United States still maintains a system of 97,000 bank branches, many of which are empty much of the time.
Stasis in consumer electronics: Television made its transition to color between 1965 and 1972. Variety increased with cable television in the 1970s and 1980s, and picture quality was improved with high-definition signals and receiving sets. Variety increased even further when Blockbuster, and then Netflix, made it possible to rent an almost infinite variety of motion picture DVDs. Now movie streaming is common. Further, homes have experienced the same access to Web information and entertainment, as well as to e-commerce, that arrived a few years earlier in the office. But smartphones and tablets have saturated their potential market, and further advances in consumer electronics have become less impressive.
Decline in business dynamism: Recent research has used the word “dynamism” to describe the process of creative destruction by which start-up and young firms become the source of productivity gains by introducing best-practice technologies and methods and shifting resources away from old low-productivity firms. The share of total employment accounted for by firms no older than five years declined by almost half from 19.2 percent in 1982 to 10.7 percent in 2011. This decline was pervasive across retailing and services, and after 2000 the high-tech sector experienced a large decline in start-ups and fast-growing young firms (Davis and Haltiwanger, 2014).
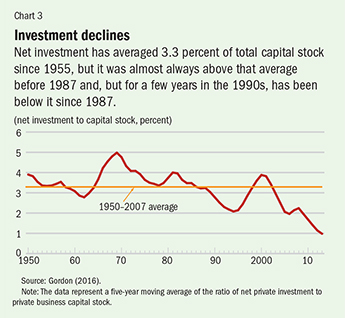
Decline in net investment: An important component of the slowdown in economic growth has been the behavior of net investment. As a share of the capital stock, real net investment averaged 3.3 percent over the period 1950–2007. But the actual values were almost always above that average before 1987 and, but for a few years in the late 1990s, have almost always been below it since 1987 (see Chart 3). Some commenters say the decline in net investment is a cause of the productivity slowdown, but there is also a reverse causation: the slump in investment is the result of the diminished impact of innovations. Firms have plenty of cash that could be invested, but they prefer instead to buy back shares.
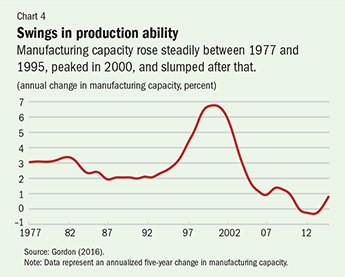
Declining growth of manufacturing capacity: As shown above, the revival in productivity growth between 1995 and 2004 was unique in the post-1970 era. Equally unique was the soaring temporary growth in the capacity of the manufacturing sector (see Chart 4). The average growth rate of capacity ranged between 2 and 3 percent from 1977 to 1995, rose to a peak of 6.8 percent in 2000, and then fell in most years after 2007 to less than 1 percent. Much of the growth in capacity in the late 1990s was associated with the information technology investment boom, but since 2011 most information technology investment equipment has been imported.
Assessing the future
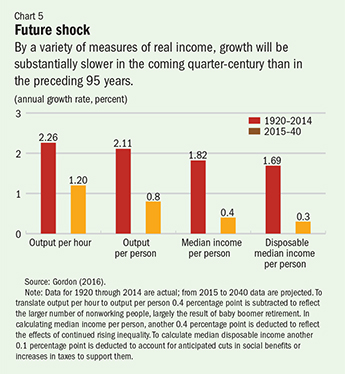
The point of departure in forecasting growth in productivity and the standard of living from 2015 to 2040 is a division of the time period since 1970 into three intervals—1970–94, 1994–2004, and 2004–15. As we have seen, the atypical 1994– 2004 interval, when output per hour grew at 2.26 percent a year, is unlikely to be repeated. The sharp upward shift in productivity associated with the digital revolution that replaced paper, file-card catalogs, file cabinets, and linotype operators with proprietary and Internet software, electronic catalogs, and flat screens emerged largely during this period. Since that decade is not a relevant basis for the likely future growth of productivity, the baseline reference point is the average growth rate achieved from 1970 to 1994 and from 2004 to 2015, or 1.38 percent a year. When we subtract 0.18 percentage point to reflect the slowing advance of educational attainment, the projected 2015–40 labor productivity growth rate is 1.20 percent (see Chart 5). This compares to a rate of 2.26 percent a year from 1920 to 2014.

To translate projected growth in output per hour to output per person, 0.4 percentage point is deducted annually, mainly to account for the retirement of the baby-boom generation. This results in a 2015–40 forecast for output per person of 0.80 percent a year, contrasting with the historical rate of 2.11 percent a year. To get to median income per person, another 0.40 percentage point a year is subtracted to reflect a continued rise in inequality at roughly the same rate experienced from 1975 to 2014. An additional subtraction of 0.1 percentage point is made for anticipated cuts in social benefits or increases in Social Security and Medicare taxes that will be needed to counteract the upward creep in the federal debt-to-GDP ratio because of an aging population. The resulting forecast for 0.3 percent annual growth in per capita disposable median income (that is, the amount of total income that can be spent) contrasts with the rate of 1.69 percent a year achieved from 1920 to 2014.
While the forecasts may appear pessimistic, they do not countenance an end to innovation and technical change. On the contrary, the prediction of 1.20 percent productivity growth is very similar to 1970–94 and 2004–15. A compound 1.2 percent growth rate would imply a level of labor productivity in the year 2040 that is 35 percent above that in 2015, and would be achieved by further innovations in robotics, artificial intelligence and big data, 3-D printing, and driverless vehicles.

But while innovation continues, the median growth rate of real income per person will be less than productivity growth because of an aging of the population and rising inequality. Government policy can affect these impediments to median income growth. The best offset to the retirement of the baby-boom generation is substantially increased immigration to lower the average age of the population and to raise the proportion that is working. A larger working population would raise tax revenue and counteract future increases in the debt-to-GDP ratio from the aging of the population. As for inequality, the government cannot prevent successful CEOs, entertainment stars, and entrepreneurs from earning high incomes, but it can use progressive taxation to redistribute income and promote more equality of after-tax incomes. ■
Robert J. Gordon is the Stanley G. Harris Professor of the Social Sciences at Northwestern University.
References
Davis, Stephen J., and John Haltiwanger, 2014, “Labor Market Fluidity and Economic Performance,” NBER Working Paper 20479 (Cambridge, Massachusetts: National Bureau of Economic Research).
Gordon, Robert J., 2016, The Rise and Fall of American Growth: The U.S. Standard of Living since the Civil War (Princeton, New Jersey: Princeton University Press).
Hortaçsu, Ali, and Chad Syverson, 2015, “The Ongoing Evolution of US Retail: A Format Tug-of-War,” NBER Working Paper 21464 (Cambridge, Massachusetts: National Bureau of Economic Research).
Opinions expressed in articles and other materials are those of the authors; they do not necessarily reflect IMF policy.

Write to us
F&D welcomes comments and brief letters, a selection of which are posted under Letters to the Editor. Letters may be edited. Please send your letters to fanddletters@imf.org