
Lost Workers
Finance & Development, September 2015, Vol. 52, No. 3
Ravi Balakrishnan, Mai Dao, Juan Solé, and Jeremy Zook
Reversing the decline in U.S. labor force participation is essential to boosting growth in the world’s largest economy

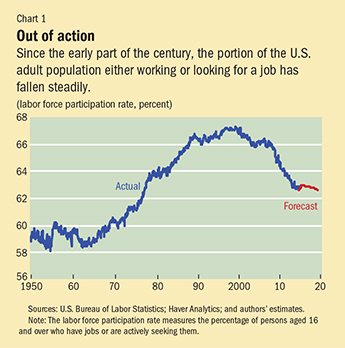
It is not supposed to be this way. As the U.S. economy recovers, hiring increases and people who had stopped looking for jobs when times were bleak should be inspired to look again. Instead, the proportion of the U.S. population 16 years and older with a job, or looking for one—the labor force participation rate—continues to fall. It went from about 66 percent at the start of the global financial crisis to 62.6 in June 2015 (see Chart 1), its lowest point since 1977.
What is more remarkable is that half of the gains in participation rates between 1960 and 2000—those driven by sweeping social changes such as the post–World War II baby boom and the entry of women into the workforce—have been reversed in the past seven years. The equivalent of 7.5 million workers has been lost from the U.S. labor force.
Critical for the U.S. economy
The future dynamics of the U.S. labor market matter for two crucial reasons. First, the size of the labor force will be central to determining the pace of U.S. economic growth over the next 5 to 10 years. And because the U.S. economy is the world’s largest, its trajectory is crucial to global growth. Second, the extent to which the recent declines in participation rates are reversible will be a principal factor affecting future wage and price inflation and, as a result, the timing and pace at which the Federal Reserve, the U.S. central bank, raises interest rates. The level and direction of U.S. rates have broad effects on capital flows around the world—especially on movement in and out of emerging market economies.
The aggregate labor force participation rate had been declining since 2000, long before the onset of the Great Recession. The golden era for increasing labor force participation was 1960–90, when rates increased from 60 to 66 percent. This reflected the post–World War II baby boom generation reaching adulthood and women’s increasing presence in the workforce. But this boost to the size of the labor force started to fade in the 1990s as baby boomers began to retire and participation rates for women began to decline. Indeed, since the bursting of the dot-com bubble and the 2001 recession (when many Internet-based companies failed), the labor force participation rate has continued to fall.
For men, the trend is longer lasting: male participation rates have been declining since records began in 1948. The downtrend for prime-age males has been of particular concern, and much research has focused on declining labor market opportunities and the associated stagnant wage growth for low-skilled workers in the 1980s, as well as increasing polarization in the 1990s (Aaronson and others, 2014).
This article focuses on the decline in the aggregate participation rate since 2000. And a mix of factors is at work. Structural changes, mostly linked to population aging, have been an important part of the downtrend. Aging matters because men and women reduce their participation markedly in the decade before age 65 (by at least 40 percentage points), and participate at even lower rates afterward. As a result, a shift in the age distribution toward older workers lowers the aggregate participation rate even if the participation rate for individual age groups does not change. In fact, the participation rate of older workers actually rose during the crisis, but the overall participation rate still fell.
However, cyclical factors related to the availability of jobs and wage behavior have also been important, particularly following the Great Recession. For policymakers, the distinction between structural and cyclical forces is paramount, because each requires a different policy response. Therefore, a key question for economists is how much of the decline is accounted for by each factor.
We found that aging is responsible for about half of the decline in participation since the Great Recession. This effect is calculated by holding the participation rate of each age group constant at the level of a particular year—2007 in our analysis—and letting the population shares of each group vary according to their historical pattern. It reflects that the share of the population 55 or older has increased significantly since 2007 (for men, for example, the share has increased by about 6 percentage points to nearly 33 percent).
To estimate the importance of cyclical factors, we use state-level data and analyze the variation in participation rates and cyclical factors across states and time. This analysis suggests that cyclical forces account for an additional 30 to 40 percent of the decline.
The remainder of the post-2007 decline reflects other forces, such as a significantly lower youth participation. This decline has not been driven mainly by increasing college enrollment rates, as some observers have conjectured, but by a decline in the number of college students who are also working. Rising applications for disability insurance have also played a role in shrinking the labor force. Some of this increase reflects population aging, with 80 percent of insurance recipients over 45, although applications clearly accelerated following the Great Recession. Even those eventually denied benefits left the labor force while their applications were pending. Although it is open to debate how much of the recent rise in disability insurance recipients is structural or cyclical, most of it is irreversible.
A temporary reversal
Importantly, we found that up to one-third of the post-2007 decline in participation rates is reversible as the U.S. jobs market continues to improve (Balakrishnan and others, 2015). Over the next few years, this should mean that about 2 million workers will return to the labor market. However, by 2017 participation rates should again start to decline as the underlying forces of population aging more than offset the cyclical bounce back.
This forecast takes into account nondemographic structural forces such as college enrollment, the share of students working, and retirement patterns. Specifically, the participation rate of younger workers is expected to bounce back somewhat as school enrollment declines a little more (and gets closer to its pre–Great Recession level) and more students start working—prodded by improved job opportunities and the need to pay off student loans. Older workers, however, are forecast to have no bounce back—since their participation rates increased during 2007–13 and the recovery of wealth lost during the crisis allows many who postponed retirement to finally do so.
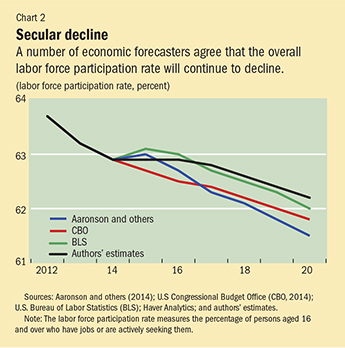
The declining trend in the overall participation rate is something predicted by other forecasters, although there are some important differences (see Chart 2). For example, in the projection by the U.S. Congressional Budget Office, the downward pressure from population aging outweighs the cyclical bounce back more than it does in our estimates over the medium term. Aaronson and others (2014) also have a lower participation rate path, as they assume that labor market polarization into low- and high-income jobs and rising disability rolls will outweigh increasing longevity, educational attainment, and changes in marriage and fertility. The U.S. Bureau of Labor Statistics has a 2020 forecast similar to ours (Toossi, 2013).
A new measure of labor market slack
What do these participation trends mean for the level of slack (that is, unused resources that can be employed without triggering inflation) in the U.S. economy?
If we look simply at the unemployment rate—which has steadily declined from double digits to about 5.5 percent in the second quarter of 2015—it may look as if there is not much labor market slack at all. After all, the rate is just above many estimates of the current “natural” level of unemployment—the rate that would prevail once cyclical factors have played themselves out and the economy is growing at trend. Some argue that a negligible difference between the unemployment rate and the natural rate—the so-called unemployment gap—is equivalent to full employment.
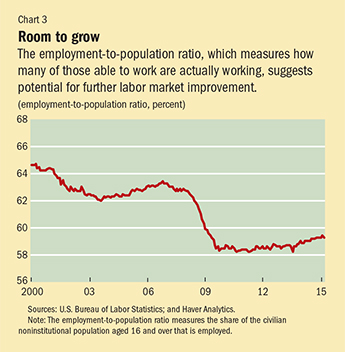
However, there is more to labor market slack than the unemployment gap, especially following the dislocations caused by the Great Recession. While a shrinking unemployment gap suggests that the economy is approaching full employment, the employment-to-population ratio paints a different picture (see Chart 3). Indeed, this ratio, which measures how many of those able to work are actually employed, is still more than 4 percentage points below its level on the eve of the Great Recession. What could cause such a disconnect? First, there are workers who want and are available for work but did not search for jobs in the previous four weeks and were not classified as unemployed (so-called marginally attached workers). Moreover, there are still numerous part-time workers who would like to work more hours but cannot as businesses continue to face difficult conditions. While there may be some structural component to the increase in part-time workers (from firms’ greater ability to predict peak loads, for example), some of it undoubtedly reflects a legacy of weak cyclical conditions. Adding these components to the unemployment rate suggests that some labor market slack remains.
As Federal Reserve Chair Janet Yellen has emphasized, a fuller picture of the labor market requires an examination of factors beyond the unemployment rate. These include gauges of labor market dynamism such as job openings, hires, and quits, which have nearly recovered to precrisis levels. The growing number of quits is particularly encouraging because it signals that people are more confident in leaving their current job to pursue higher-paying, better-fitting opportunities.
To bring all these elements into a single measure of slack, we compute a broadly defined “employment gap” that includes deviations of unemployment and participation rates from their trend or natural levels and adjusts for the large number of involuntary part-time workers.
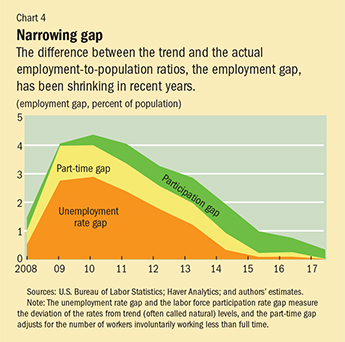
As one would expect, our measure shows a substantial employment gap following the Great Recession, largely driven by bulging unemployment and involuntary part-time workers. The participation gap, in turn, started to grow after 2010, as the prolonged recession led many to become discouraged and abandon the workforce (see Chart 4). It is this legacy that the labor market has been working through. Now, with an unemployment rate that has fallen to well within 1 percentage point of most estimates of the natural rate of unemployment, the remaining slack stems mainly from the participation gap, and to a lesser extent from the part-time gap. We expect that overall labor market slack (that is, the employment gap) will disappear in 2018. This gradual decline in labor market slack implies a still important role for accommodative macroeconomic policies, such as supportive monetary policy measures, to help reach full employment.
Boosting the participation rate
Moreover, policies to reverse the decline in the participation rate are vital to the labor supply expansion needed to boost potential growth over the next 5 to 10 years. Enhancing growth is a key preoccupation in the United States, where many forecasts put potential growth around 2 percent—far from the more than 3 percent average rates that prevailed before the Great Recession.
Key measures include enhancing job search and training programs and targeting benefits for low-income families—child care support, for example. Immigration reform should also be part of the solution. To counter the effects of an aging population, the United States should augment its visa program for high-skilled immigrants, which would also enhance the productivity of the workforce. ■
Ravi Balakrishnan is a Deputy Division Chief and Juan Solé is a Senior Economist, both in the IMF’s Western Hemisphere Department. Mai Dao is an Economist in the IMF’s Research Department. Jeremy Zook is an Economist at the U.S. Treasury Department.
References
Aaronson, Stephanie, Tomaz Cajner, Bruce Fallick, Felix Galbis-Reig, Christopher L. Smith, and William Wascher, 2014, “Labor Force Participation: Recent Developments and Future Prospects,” Finance and Economics Discussion Series Staff Working Paper 2014–64 (Washington: Federal Reserve Board).
Balakrishnan, Ravi, Mai Dao, Juan Solé, and Jeremy Zook, 2015, “Recent U.S. Labor Force Dynamics: Reversible or Not?” IMF Working Paper 15/76 (Washington: International Monetary Fund).
Congressional Budget Office (CBO), 2014, “The Budget and Economic Outlook: 2014 to 2024” (Washington, February).
Toossi, Mitra, 2013, “Labor Force Projections to 2022: The Labor Force Participation Rate Continues to Fall,” Monthly Labor Review (December).

Write to us
F&D welcomes comments and brief letters, a selection of which are posted under Letters to the Editor. Letters may be edited. Please send your letters to fanddletters@imf.org