
The Rich and the Great Recession
Finance & Development, June 2015, Vol. 52, No. 2

Focusing on middle-class behavior to explain the boom and bust in the United States may be too narrow
The conventional narrative about the great recession that began in the United States in 2007 focuses on the housing price boom and bust and the effects on spending by the middle class, most of whose wealth is concentrated in housing.
The rich have been accorded little, if any, part in the spending boom and bust. The well-to-do play a role, but only as generators of “excess saving” (Kumhof, Rancière, and Winant, 2013). According to that explanation, the spectacular rise in the incomes of the rich that started in the 1980s induced them to lend their increased savings to the hard-pressed middle class, who used the funds to maintain their consumption growth and speculate in real estate (Rajan, 2010).
Initially, all went well, as the real estate boom propelled a construction-based expansion. But by 2007, the music had stopped. The middle class became overextended and ceased buying houses, causing prices to collapse so sharply that many homeowners were suddenly underwater on their mortgages—that is, they owed more to their mortgage lenders than their houses were worth. Some defaulted. Others rapidly increased their saving rates so they could pay down their debts (Mian and Sufi, 2014), curtailing consumption in the process. The result was a deep recession.
But the conventional narrative is incomplete. It was not just the drop in housing wealth that made the Great Recession so deep, but also the decline in financial wealth. Moreover, the rich were not merely passive spectators, but active participants in the consumption cycle. In fact, given the size of their asset holdings, the swings in the spending of the rich were probably a primary motor of the boom and subsequent bust (Bakker and Felman, 2014).
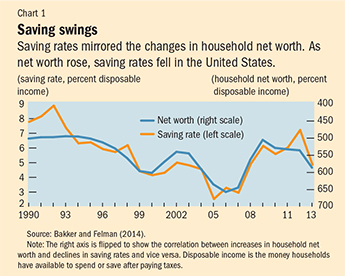
Wealth effects played a key role in the precrisis drop and postcrisis surge in the household saving rate (see Chart 1). Asset prices soared during the boom years, making people feel wealthier, inducing them to increase consumption and reduce their saving rate. When asset prices collapsed during the crisis, wealth effects went into reverse, leading to a fall in consumption (Case, Quigley, and Shiller, 2011).
Mian and Sufi (2014) have argued that the swings in housing prices were particularly critical, because the acquisition of real estate, unlike the purchase of financial assets, is largely funded by borrowing. Accordingly, declines in housing prices created financial difficulties, forcing households to scale back their spending. They argue that this dynamic explains why the Great Recession was so much more severe than the so-called dot-com bust (the collapse in 2000 of stock prices following a three-year boom driven by Internet companies), even though losses in stock wealth were about the same as those in housing wealth later in the decade.
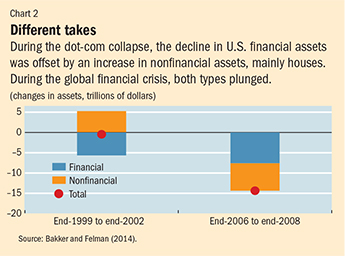
But the explanation may be much simpler. The dot-com bust was mitigated by an increase in nonfinancial assets (mostly housing), while the housing market crash was exacerbated by a drop in financial assets (see Chart 2). In fact, financial assets accounted for $8 trillion of the $13 trillion in peak-to-trough losses in wealth. Put another way, one reason the cutbacks in consumption during the Great Recession were so much deeper than during the dot-com bust was because the overall wealth losses were much larger.
Saving rate of the rich
Why did the aggregate household saving rate decline in the precrisis years, even as there was a shift in income distribution toward the presumably high-saving rich? The standard explanation is that the reduction in saving by the middle class was much bigger than the increase in saving by the rich. There are no aggregate data on saving by income class. Nevertheless, the standard explanation is implausible.
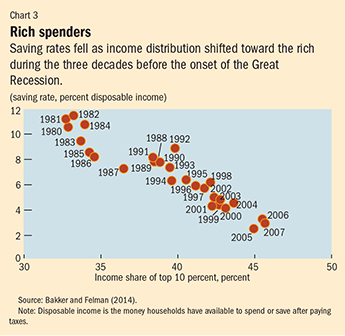
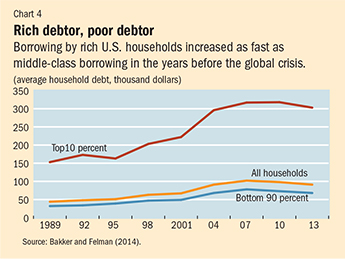
If the rich had been saving heavily before the crisis, it is difficult to explain why the correlation between the distribution of income and saving over the past three decades has been strongly negative: the greater the income share of the rich, the lower the aggregate saving (see Chart 3). Moreover, in the run-up to the crisis, the debt of the rich actually increased as rapidly as that of the middle class (see Chart 4). This evidence suggests that the saving rate of the rich must have been falling.
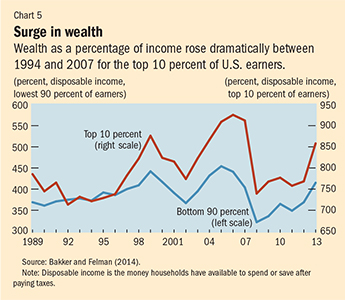
But why would the rich have reduced their saving rate at a time when their incomes were rising rapidly? They were responding to the surge in their wealth. The wealth-to-income ratio of the top 10 percent of earners soared from 721 percent in 1994 to 912 percent in 2007. By contrast, the wealth-to-income ratio of the bottom 90 percent increased only moderately in that period, from 373 to 404 percent (see Chart 5). While rising incomes may have encouraged higher saving among the rich, this was more than offset by the impact of the even faster growth in their wealth, which spurred them to spend more and resulted in a lower overall rate of saving relative to income.
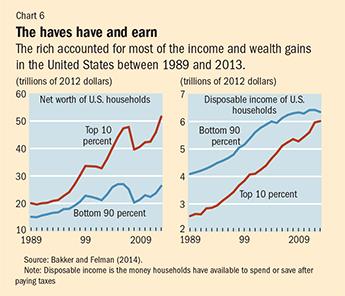
If the saving rate of the rich followed the same cycle as that of the middle class, then the rich must have played a key role in driving the boom and bust in consumption. After all, they comprise the group that accounted for the bulk of the income and wealth gains during this period (see Chart 6).
To demonstrate this empirically, we estimated a consumption model that links household consumption to (1) income of the top 10 percent, (2) income of the bottom 90 percent, and (3) aggregate household wealth. Our estimates show that of every extra dollar in income, the middle class will consume 95 cents, compared with only 65 cents for the rich. That suggests that the rich save a lot more. But the rich also have more wealth. Our estimates suggest that the marginal propensity to consume out of wealth is 2.2 percent, which means that for every extra dollar in wealth, consumption will increase by 2.2 cents. This may not seem a high percentage, but because the wealth of the top 10 percent is so high ($50 trillion) the impact on consumption is considerable.
Next, we used the model to calculate the role of the rich in driving consumption. We would expect a significant role, simply because their income and wealth gains have been so much larger than those of the middle class.
Indeed, the model suggests something truly striking. The top 10th of earners accounted for the bulk of overall consumption growth. Between 2003 and 2013, about 71 percent of the increase in consumption came from the rich. Much of the slowdown in consumption between 2006 and 2009 was the result of a drop in consumption by the rich. And the rich also played a key role in the subsequent recovery as the rebound in their wealth encouraged a revival of consumption (though a weak one, because income growth and wealth-income ratios remained below precrisis levels).
Many actors
Our results are not definitive, because there are no firm data on the spending behavior of the rich (or of the middle class, for that matter). Still, the evidence that is available suggests that the standard narrative of the Great Recession needs to be adjusted. Housing played a role, but so did financial assets, which actually accounted for the bulk of the loss in wealth. The middle class played a role, but so did the rich. Indeed, the rich may have accounted for the bulk of the swings in aggregate consumption during the boom and bust. These findings are not just of historical interest. They have important implications for the outlook. The rich now account for such a large share of income—and their wealth is so large—that fluctuations in their assets could shake up the economy more than ever going forward. ■
Bas Bakker is an Advisor in the IMF’s European Department and Joshua Felman an Assistant Director in the IMF’s Research Department.
References
Bakker, Bas B., and Joshua Felman, 2014, “The Rich and the Great Recession,” IMF Working Paper 14/225 (Washington: International Monetary Fund).
Case, Karl E., John M. Quigley, and Robert Shiller, 2011, “ Wealth Effects Revisited, 1978–2009,” Cowles Foundation Discussion Paper No. 1884 (New Haven, Connecticut: Yale University).
Kumhof, Michael, Romain Rancière, and Pablo Winant, 2013, “Inequality, Leverage and Crises: The Case of Endogenous Default,” IMF Working Paper 13/249 (Washington: International Monetary Fund).
Mian, Atif, and Amir Sufi, 2014, House of Debt: How They (and You) Caused the Great Recession, and How We Can Prevent It from happening Again (Chicago: University of Chicago Press).
Rajan, Raghuram, 2010, Fault Lines: How Hidden Fractures Still Threaten the World Economy (Princeton, New Jersey: Princeton University Press).

Write to us
F&D welcomes comments and brief letters, a selection of which are posted under Letters to the Editor. Letters may be edited. Please send your letters to fanddletters@imf.org