
Measure to Measure
Finance & Development, September 2014, Vol. 51, No. 3
Jonathan D. Ostry and Andrew G. Berg
Inequality may be a hot topic, but describing it is a difficult proposition

Although growing economic inequality has become an important economic and political topic in recent years, its precise definition is often fuzzy. It could describe the relative fate of the middle class, or the income of the top 1 percent. It can be gauged before or after taxes and transfers. What is measured has much to do with what is concluded and with which policy responses should be considered.
Moreover, as the reality of inequality is increasingly accepted, attention has turned to what, if anything, to do about it—such as whether to redistribute income, if so how, and what the effects of redistribution might be. As with inequality, the definition of “redistribution” and how it is measured make a critical difference to analysis and policy.
What is inequality?
All economic concepts present difficult measurement and conceptual issues, but inequality perhaps more than most. Measurement of GDP, for example, is itself enormously complicated. But at least the goal is clear: calculation of the total output of an economy. Inequality, in contrast, is more like, say, “competitiveness”—any simple measure is an attempt to boil a complex issue down to one number.
Most inequality data come originally from surveys that typically ask households about income from various sources, taxes, and consumption. The information gleaned is highly imperfect. Surveys, which are expensive and complex, generally are undertaken only every few years at best. And there is no guarantee that the surveys are representative. The rich may be harder for the surveyors to find and may be less likely to participate when identified.
Often, researchers want to compare inequality across time and countries, which is difficult for many reasons:
• Surveys vary in important ways. For example, there are several ways to define income. It could include only factor remuneration such as wages from labor and profits from capital (market income), or it could also include transfers such as private gifts, government subsidies, and pensions or in-kind resources such as food stamps and tax payments (net or disposable income). Also, surveys may report inequality in consumption rather than income.
• The unit of analysis also varies. A survey could look at income per person, per household, or per tax unit (which is often not the same as a household). Commonly, surveys report income per “adjusted household”—which aims to take into account that costs per family member go down as the size of the household rises.
Because of these and other problems with surveys, particularly their problems tracking the income of the rich, economists began looking to tax records as a source of income distribution data (Atkinson, Piketty, and Saez, 2011). Tax data have several advantages over survey data: the data are available for all taxpayers so the rich are better represented, and it is possible to look at small segments, such as the top 0.1 percent. Moreover, the data tend to be available annually and often as far back as the early 20th century.
But there are also important disadvantages to using tax data. First, the many poor and even middle-class people who do not pay income taxes are excluded. Second, there is generally little information on actual taxes paid and transfers received that allows the calculation of disposable income. Third, data are available only for advanced economies and a handful of emerging markets. And fourth, tax-based data have their own measurement problems related to misreporting and the use of tax avoidance strategies, many of which are perhaps particularly available to the richest.
What is measured matters
When it comes to these disparate and imperfect measurements, a key principle is to use the right measurement for the question asked.
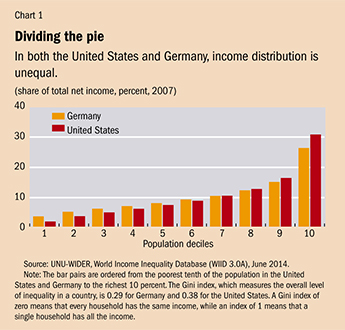
Let’s start with a simple comparison of the United States and Germany based on data on disposable income of adjusted households (see Chart 1). Disposable income essentially is the income and transfer payments received by households minus taxes. We need to boil down the information into something we can readily compare. There are many ways to do this, and each has its uses.
The Gini index is the most commonly used summary measure. It gauges the average difference in income between any two households (or individuals), randomly chosen from the entire population. It is scaled so that it varies from zero to 1: zero means that all households receive the same income and 1 means that one household gets all the income. Because it captures the entire distribution and is available for many countries, the Gini index is especially useful for understanding the overall macroeconomic implications and determinants of income inequality.
The share going to the very rich—the top 1 percent or 0.1 percent—has received much attention recently because it has risen sharply in some countries since about 1980. The increase has been so concentrated at the very top of the distribution that Gini measures, which look at the entire income distribution and are survey based, have not captured it well.
The share of the top 1 percent may be a more useful measure partly because it gauges a particularly important feature of the income distribution for some purposes, such as the ability of the fabulously rich to capture the political process. As the late U.S. Supreme Court Justice Louis Brandeis once observed: “We may have democracy, or we may have wealth concentrated in the hands of a few, but we can’t have both.” He did not have in mind general measures of inequality such as the Gini. Authors such as Joseph Stiglitz (2012) argue that the traditional focus on the Gini index has caused many analysts to miss the implications of the rise in top incomes for the evolution of political power in the United States. For some purposes, however, broader measures are more useful. For example, more unequal countries tend to have lower intergenerational mobility when Gini is the measure, but not for the top 1 percent measure.
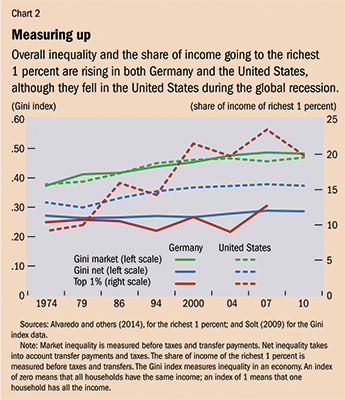
Chart 2 shows the evolution of the Gini index for market inequality (before taxes and transfers) and the share going to the top 1 percent in Germany and the United States. Both measures show increases in the two countries, but the increase is much sharper for the top 1 percent in the United States. Another striking result is that market income inequality—as measured by the Gini—is about equal in Germany and the United States.
Inequality and growth
In our study of inequality, we have focused on the implications of inequality for the sustainability of growth in a large sample of countries. We hypothesized that many mechanisms linking inequality and growth may be at work, including the effect of inequality on the ability of the poor and middle class to accumulate human capital; on political stability and thus incentives to invest; on social cohesion and the ability to resist and forcefully adjust to shocks; and on political pressures for redistribution, which may dull incentives and thus slow growth. Because we wanted to encompass all these channels without taking a stand on which one mattered most, and because we needed a large sample of countries and time periods, the Gini served admirably. In Berg and Ostry (2011) we added to the tentative and perhaps growing consensus among researchers by concluding that higher inequality is associated with less durable growth.
The attention that has been focused on inequality is turning to redistribution of income. Our findings on inequality and growth were ambiguous about the implications for redistribution. If more unequal countries tend to try to redistribute more, and such redistribution (higher tax rates, subsidies) weakens incentives to work and invest, then redistribution is not a “treatment” for inequality but part of the problem, at least when it comes to growth.
We faced two difficult measurement issues. First, most cross-country data sets on inequality contain mainly information on inequality of net (disposable) income. However, to examine whether more unequal countries redistribute more requires looking at the relationship between market inequality and redistribution, because net inequality confounds the effects of the underlying market inequality and of redistribution. Second, we wanted to measure redistribution itself to assess the second leg of the story: whether redistribution matters for growth, as in the big trade-off between equality and efficiency described by Arthur Okun (1975).
It turns out, though, that redistribution is even harder than inequality to measure well. Most efforts have focused on proxies for redistribution, such as government spending on health, education, and social subsidies, on the one hand, and total revenues or tax rates on the other.
But these proxies are very imprecise. Much taxation may not be particularly progressive, such as payroll or sales taxes. Similarly, the benefits of social spending may or may not flow mainly to lower-income groups. For example, much education spending in developing economies is focused on secondary and higher education, which benefits mainly those who are better off, while much health care spending supports urban hospitals that may not be targeted toward poor or even middle-income citizens. When measuring redistribution using these proxies, researchers have found little evidence that more unequal countries redistribute more. But when measurement improves, results are clearer. Milanovic (2000) took advantage of a high-quality data set for mainly industrial countries maintained by the Luxembourg Income Study. It provides largely comparable data on both market and net inequality. He found that redistribution is strongly related to the level of market inequality for this set of rich democracies.
Our interest has been in determinants of economic growth in all countries. Fortunately, a relatively new data set from political scientist Frederick Solt (2009) makes a strong effort to compile just the information we required. Solt standardized available high-quality survey-based inequality data along key dimensions. He collected information from surveys by the World Bank, the United Nations, and others on Ginis of all income definitions (such as market income and net income) and accounting units (such as per household or per capita). He then analyzed the many cases for which several measures of inequality are available for a given country and time period to estimate the typical relationship between the different measures. For example, in Latin American countries in the 1970s, inequality in consumption had a fairly predictable relationship with inequality of disposable income. From this information, and hundreds of similar relationships systematically exploited, Solt inferred standardized measures of net and market income inequality for a large number of countries and time periods.
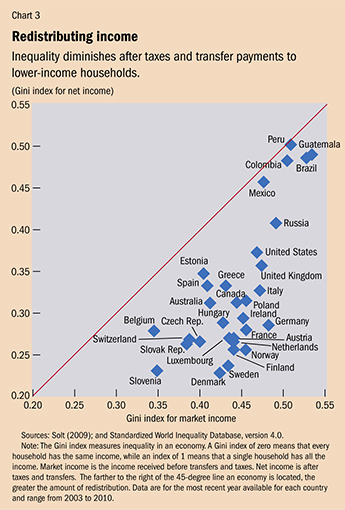
This sort of information on net and market inequality yields some striking findings. For example, while it is common knowledge that the United States is much more unequal than Germany and that Latin America is more unequal than Europe, what is less well known is that these comparisons are mainly true with respect to net income. The outcome in terms of market inequality (income before taxes and transfers) is remarkably similar (see Chart 3).
More generally, because countries with a more unequal distribution of market income tend to redistribute more, such countries do not necessarily have a substantially more uneven distribution of net income—on average, redistribution makes up about 60 percent of the difference. The United States is an outlier among rich countries for its high inequality of net income, but this is as much because of the relatively small scale of redistribution as because of high market inequality.
New ground
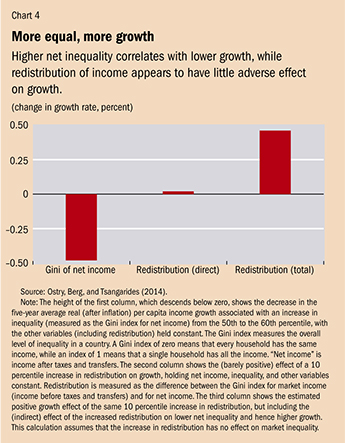
In our own work (Ostry, Berg, and Tsangarides, 2014) with the Solt data we have drawn three broad conclusions. First, more unequal societies tend to redistribute more, not just rich countries, but also (though to a generally lesser extent) those whose economies are just developing. Second, lower net inequality is robustly correlated with faster and more durable growth, for a given level of redistribution. And third, redistribution—measured as the difference between market and net inequality—appears generally benign in terms of its impact on growth (Chart 4 illustrates the last two conclusions). Only in extreme cases is there some evidence that it may hurt growth. Thus the combined direct and indirect effects of redistribution are on average pro-growth. Of course we need to be cognizant of the inherent limitations of the data set and of cross-country comparisons more generally. And clearly the specifics of redistribution policies matter (IMF, 2014). But based on our work we should be careful not to assume that there is a big trade-off between redistribution and growth.
Many exciting topics in this area are being actively explored. Clearly, though, a priority is the collection and analysis of more and better data, including more and better inequality and redistribution data for a larger number of countries, richer country-level examinations of fiscal redistribution (Lustig and others, 2013), and more attention to wealth—as opposed to income—inequality. We cannot wait, however, for the perfect data to arrive: we must both work to improve the data and carefully use the data we already have. ■
Jonathan D. Ostry is Deputy Director and Andrew G. Berg is Assistant Director, both in the IMF’s Research Department.
References
Alvaredo, Facundo, Anthony B. Atkinson, Thomas Piketty, and Emmanuel Saez, 2014, The World Top Incomes Database. http://topincomes.g-mond.parisschoolofeconomics.eu
Atkinson, Anthony, Thomas Piketty, and Emmanuel Saez, 2011, “Top Incomes in the Long Run of History,” Journal of Economic Literature, Vol. 49, No. 1, pp. 3–71.
Berg, Andrew, and Jonathan Ostry, 2011, “Inequality and Unsustainable Growth: Two Sides of the Same Coin?” IMF Staff Discussion Note No. 11/08 (Washington: International Monetary Fund).
International Monetary Fund (IMF), 2014, “Fiscal Policy and Income Inequality,” IMF Policy Paper (Washington).
Lustig, Nora, and others, 2013, “The Impact of Taxes and Social Spending on Inequality and Poverty in Argentina, Bolivia, Brazil, Mexico, Peru and Uruguay: An Overview,” Tulane Economics Working Paper No. 1316 (New Orleans, Louisiana: Tulane University).
Milanovic, Branko, 2000, “The Median-Voter Hypothesis, Income Inequality, and Income Redistribution: An Empirical Test with the Required Data,” European Journal of Political Economy, Vol. 16, No. 3, pp. 367–410.
Okun, Arthur M., 1975, Equality and Efficiency: The Big Tradeoff (Washington: Brookings Institution).
Ostry, Jonathan, Andrew Berg, and Charalambos Tsangarides, 2014, “Redistribution, Inequality, and Growth,” IMF Staff Discussion Note No. 14/02 (Washington: International Monetary Fund).
Solt, Frederick, 2009, “Standardizing the World Income Inequality Database,” Social Science Quarterly, Vol. 90, No. 2, pp. 231–42.
Stiglitz, Joseph E., 2012, The Price of Inequality: How Today’s Divided Society Endangers Our Future (New York: W.W. Norton).

Write to us
F&D welcomes comments and brief letters, a selection of which are posted under Letters to the Editor. Letters may be edited. Please send your letters to fanddletters@imf.org