No Magic Threshold
Finance & Development, June 2014, Vol. 51, No. 2
Andrea Pescatori, Damiano Sandri, and John Simon
There appears to be no clear point above which a nation’s debt dramatically compromises medium-term growth

ECONOMISTS have debated whether there is a threshold in the level of government debt to GDP above which a nation’s medium-term economic growth prospects are dramatically compromised. Whether there is such a tipping point is of critical importance not just because of the historically high level of public debt in many advanced economies, but also because of its implications for debt accumulation in all economies. If there is a level above which debt substantially lowers growth, then reducing debt below that threshold should be a high priority. On the other hand, if there is no point at which growth prospects start to decline dramatically, then policymakers may find it appropriate to give priority to increasing growth rather than reducing debt ratios.
There is no agreement on the issue among researchers. Influential papers such as Reinhart and Rogoff (2010) and Reinhart, Reinhart, and Rogoff (2012) argue that there is a threshold effect: when debt in advanced economies exceeds 90 percent of GDP there is an associated dramatic worsening of growth outcomes. Others dispute the notion that there is such a clear threshold and suggest that it is weak growth that causes high debt rather than high debt that causes weak growth (Panizza and Presbitero, 2012; Herndon, Ash, and Pollin, 2013). Using a new approach we found little evidence that there is any particular debt ratio above which growth falls sharply.
A new approach
The fresh approach we took utilizes a new and comprehensive IMF database on gross government-debt-to-GDP ratios, interest payments, and primary deficits that covers nearly all the 188 IMF members—for many of them from 1875 to 2011 (Abbas and others, 2010, 2011). We augmented the IMF data with real GDP data from Maddison (2003) and other data from Reinhart and Rogoff (2010). We focused on 34 advanced economies, reflecting the availability and coverage of the supplementary data. The average debt-to-GDP ratio in the 34-country sample was 55 percent, while the average real output per capita growth rate was 2¼ percent a year. Given that the sample encompasses two world wars and the Great Depression there is rich historical experience, but it also includes many unique circumstances that need to be borne in mind when analyzing the results.
We considered all episodes in which gross public debt rose above a certain threshold (we used a number of them) and looked at the real GDP growth per capita over the subsequent 1, 5, 10, and 15 years. An important difference in our methodology from that of Reinhart and Rogoff’s 2010 paper is that we focus on the medium- to long-term relationship between today’s stock of debt to GDP and subsequent GDP growth rather than on just the short-term relationship. The longer-term perspective should mitigate the confounding effects that temporary recessions or bursts of growth can have on the relationship between debt and growth in the short run.
Reinhart, Reinhart, and Rogoff (2012) used a longer-term methodology, but our approach also differs from theirs in two additional important aspects:
• We considered a broad range of debt thresholds, not just 90 percent.
• Instead of considering only the period when debt is above a certain level, we analyzed the growth performance of the episodes over a given period of time regardless of the debt outcome.
The advantage of this approach is that it avoids biasing the results toward countries that failed to reduce their debt, a problem that occurs when analysis focuses only on situations in which debt remains above a certain threshold. We included both countries that were able to reduce debt after it rose above a given threshold (the successes) and countries that were not (the failures). Studies that look solely at periods when debt is above a certain threshold are implicitly focusing only on failures.
We also stipulated that a new episode cannot begin until 15 years after the previous one to avoid double-counting of overlapping episodes. The choice of this long period for our study reflects the fact that debt reduction is typically a long, drawn-out process. Nonetheless, the results were similar when we used a 10-year window. We also required that each episode begin with debt crossing a given threshold from below. This implies that each country only has a relatively small number of episodes that are, importantly, weighted equally when computing averages. The approach that Reinhart and Rogoff (2010) followed gave instead equal weight to each country independent of the number of years with high or low debt. As emphasized in Herndon, Ash, and Pollin (2013), different weighting can potentially lead to significantly different conclusions about the presence of a clear threshold effect.
The short term
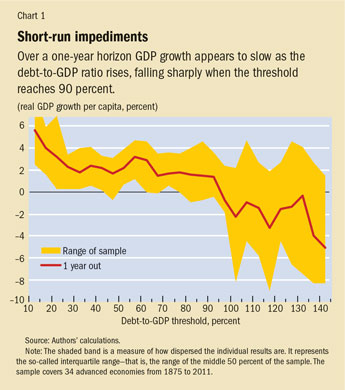
We first focused on the short-run association between debt and growth, an approach similar to Reinhart and Rogoff’s. Chart 1 shows the average real (after-inflation) GDP growth rate per capita in the year after the debt-to-GDP ratio rises above a given threshold. Consistent with Reinhart and Rogoff, we observed that GDP growth is particularly low in the year after the debt-to-GDP ratio exceeds 90 percent. Indeed, Chart 1 shows that GDP growth averages about 2 percent in countries with debt below 90 percent and tumbles to about –2 percent in countries whose debt ratio rises above that level. At the same time, the shaded area in Chart 1—which captures the degree of uncertainty around our estimates—reveals considerable diversity in the growth performance for countries whose debt rises above 90 percent.

It would be unwise, however, to look for a causal relationship between debt and growth in Chart 1 because of the possibility that weak growth caused the debt increase—the reverse causation we discussed above. While it is possible that when the debt-to-GDP ratio exceeds 90 percent countries enter a state of distress that leads to a substantial reduction in growth, it is also possible that increases in public debt above 90 percent are driven by some other factor that reduces GDP and tax revenues—which, in turn, leads to higher debt.
Furthermore, as suggested by the degree of uncertainty captured by the shaded area, these results are relatively fragile and unduly influenced by outliers. For example, the debt-to-GDP ratio in Japan increased from 133 percent in 1943 to 204 percent in 1944, and the subsequent growth rate in 1945 was –50 percent. This observation alone leads to a considerable reduction in the average growth of economies with debt thresholds above 135 percent of GDP.
Extending the horizon of analysis allows us to lessen the bias induced by reverse causality and the effect of outliers such as the sharp growth decline in Japan in 1945, as well as by the effects of potentially omitted variables. Omitted variables could include automatic stabilizers such as unemployment insurance or progressive income tax rates. During a period of low growth these stabilizers tend to lead to a deterioration of the primary balance (a nation’s surplus or deficit before interest payments) and, as a result, an increase in debt over the short term. Similarly, and even more mechanically, a recession will raise the debt-to-GDP ratio because the denominator (GDP) decreases. If high debt (that is, debt above some threshold) operates as a drag on growth over anything but the short run, however, we would expect to observe weak growth not only in the year after the debt ratio exceeds the threshold, but also during subsequent years.
Longer views

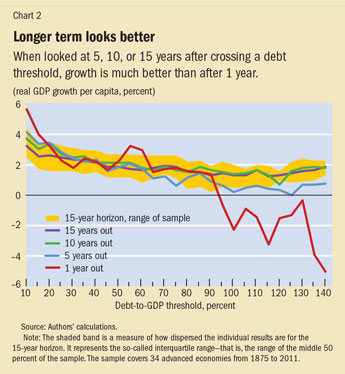
Chart 2 shows the growth performance of the same episodes over longer horizons of 5, 10, and 15 years. Relative to the 1-year horizon, performance is less affected by higher debt at the 5-year horizon and much less affected at horizons of 10 and 15 years. Importantly, while higher debt is still associated with milder growth, there is no longer any clear debt-to-GDP threshold above which growth deteriorates sharply. What this suggests is that the effect observed at the 1-year horizon is temporary and, as such, much more likely to be indicative of poor growth leading to high debt than high debt leading to poor growth. This view is reinforced by the observation that the weakening relationship between growth and debt over longer periods of time does not reflect the fact that the debt-to-GDP ratio falls sharply after exceeding a high threshold. Indeed, while there is some tendency for the debt ratio to shrink when it reaches particularly high levels, the process is extremely slow.
Debt trajectory matters
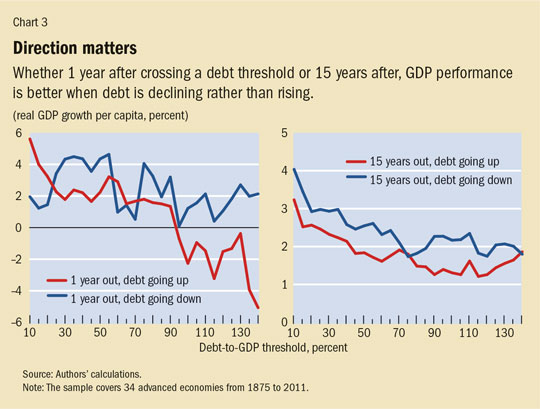
So far we have considered only those episodes in which the debt-to-GDP ratio rises above a given threshold. But what about countries that have a high, but falling, debt ratio? To investigate this question we identified all episodes in which debt ratios fell below a certain level. Chart 3 compares the growth performance during these episodes with the previous ones. The left panel shows that the sharp reduction in the following year’s growth that we observed in countries whose debt rose above 90 percent is no longer present for countries that have high but declining debt. In fact, even countries with debt ratios of 130 to 140 percent that are on a declining path have experienced solid growth. This suggests that high debt itself is not causing the low growth in these episodes. Furthermore, the right panel of Chart 3 shows that the initial debt trajectory remains important even after 15 years, with falling debt associated with higher growth. That is, the trajectory of debt appears to be an important predictor of subsequent growth, buttressing the idea that the level of debt alone is an inadequate predictor of future growth.


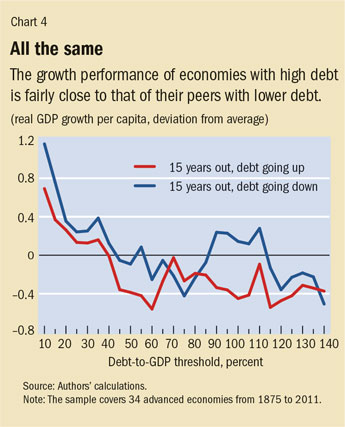
The episodes we considered occurred between 1875 and the end of the 20th century. Over this time, average growth varied substantially, from lows during the Great Depression of the 1930s to highs during the 1950s. Thus, it is possible that our results are distorted, for example, by the generally high growth experienced by all countries immediately after World War II. To control for this possibility, we compared an economy’s average growth rate during an episode with the simple average of growth rates for all economies over the same period. Chart 4 replicates the right panel of Chart 3, replacing absolute growth for each episode with this measure of relative growth. What we found is that, in general, the growth performance of economies with high debt is fairly close to that of their peers with lower debt. The differences are less than ½ percent a year—except for economies with the lowest debt levels, for which the difference can be larger. Furthermore, we found that an economy’s debt trajectory still matters. Among economies with the same debt levels, the growth performance over the next 15 years in countries in which debt is initially decreasing is better than that in countries where it is initially increasing. This difference is statistically significant across the whole sample. It is particularly striking for debt levels between 90 and 115 percent of GDP (for which average growth is ½ percentage point higher). Furthermore, there is no unique threshold that is consistently followed by a subpar growth performance. In fact, Chart 4 shows that economies with a debt level between 90 and 110 percent of GDP outperform their peers when debt is on a declining trajectory. At the least, this suggests that the debt level alone is insufficient to explain the growth potential of an economy. It also suggests that countries that have dealt with their budget deficits (as indicated by a declining debt level) may be well placed to grow in the future despite high debt levels.
No simple threshold
Our analysis of historical data has shown that there is no simple threshold above which debt ratios severely undermine medium-term growth prospects. On the contrary, the association between debt and growth at high levels of debt becomes rather weak when the focus is on any but the shortest-term relationship—especially when compared with the average growth performance of country peers. Furthermore, we found evidence that the relationship between the level of debt and growth is, importantly, influenced by the trajectory of debt: countries with high but declining debt have historically grown just as fast as their peers.
Like the earlier studies, our analysis is subject to limitations that caution against drawing out policy implications that are too strong. For example, despite mitigating the short-term reverse causality problems (in which low growth leads almost mechanically to higher debt), our methodology is unable to clearly identify the structural relationship between debt and growth.
However, if we were to take our findings at face value, we would see some important policy implications. First, debt levels are weak predictors of growth outcomes, and policies that aim to strengthen growth should thus consider a variety of other factors. Second, the fact that high but declining debt does not negatively affect growth suggests a more optimistic assessment of the outlook for countries currently dealing with high debt. Third, the absence of a specific debt threshold above which growth prospects are severely impaired means that economies can focus on the net medium-term effects of stabilization policies rather than worry that a short-term excursion above a particular debt threshold will lead to large and negative results. This should, at least, give policymakers greater flexibility when considering the best path toward an ultimate objective of declining debt ratios. ■
Andrea Pescatori and Damiano Sandri are Economists in the IMF’s Research Department. John Simon is a former Senior Economist in the IMF’s Research Department who is now Deputy Head of Research at the Reserve Bank of Australia.
This article is based on the authors’ 2014 IMF Working Paper 14/34, “Debt and Growth: Is There a Magic Threshold?”
References
Abbas, S. M. Ali, Nazim Belhocine, Asmaa A. ElGanainy, and Mark A. Horton, 2010, “A Historical Public Debt Database,” IMF Working Paper 10/245 (Washington: International Monetary Fund).
———, 2011, “Historical Patterns and Dynamics of Public Debt—Evidence from a New Database,” IMF Economic Review, Vol. 59, No. 4, pp. 717–42.
Herndon, Thomas, Michael Ash, and Robert Pollin, 2013, “Does High Public Debt Consistently Stifle Economic Growth? A Critique of Reinhart and Rogoff,” Political Economy Research Institute Working Paper No. 322 (Amherst, Massachusetts).
Maddison, Angus, 2003, The World Economy: Historical Statistics (Paris: Organisation for Economic Co-operation and Development).
Panizza, Ugo, and Andrea F. Presbitero, 2012, “Public Debt and Economic Growth: Is There a Causal Effect?” MoFiR Working Paper No. 65 (Ancona, Italy: Money and Finance Research Group).
Reinhart, Carmen M., and Kenneth S. Rogoff, 2010, “Growth in a Time of Debt,” American Economic Review, Vol. 100, No. 2, pp. 573–78.
Reinhart, Carmen M., Vincent R. Reinhart, and Kenneth S. Rogoff, 2012, “Public Debt Overhangs: Advanced-Economy Episodes since 1800,” Journal of Economic Perspectives, Vol. 26, No. 3, pp. 69–86.


