
The Price of Maturity
Finance & Development, June 2011, Vol. 48, No. 2
Watch video: Global aging
Listen to podcast: Costs of aging in China
Aging populations mean countries have to find new ways to support their elderly

THE WORLD’S POPULATION will reach 7 billion this year and is projected to exceed 9 billion in 2050. But despite the overall increase, hidden behind these headline numbers are important changes in the age distribution of the population. In the rich industrial nations as well as some middle- and lower-income countries, populations will age as the proportion of elderly people within the mix rises dramatically.
Surprisingly, this population aging is driven more by low fertility than by longer life. Low fertility means fewer children to grow up and enter the workforce, while the number of elderly keeps rising. But people are also living longer, which reinforces the effects of low fertility. Between now and 2050, about 1 billion working-age adults and 1.25 billion members of the age 60+ population will be added to the global population, while the number of people younger than 25 is projected to hold steady at 3 billion (UN, 2009).
These changes have worrisome implications for both policymakers and individuals, since most elderly people are no longer part of the labor force and their consumption must be funded by their younger family members, by public or private pensions, or by their accumulated asset holdings. As the ratio of elderly to working-age people rises, it becomes more difficult to fund them through public or private transfers, and asset accumulation is often inadequate.
We examine how the elderly are supported in different countries and discuss how these support systems will be affected by population aging. The ways populations have supported the elderly in the past won’t always work in the new demographic reality.
More elders
Why will the number of elderly people grow faster than the number of working-age people? Countries around the world had unusually large cohorts of children during the second half of the 20th century. Many high-income countries experienced a baby boom after World War II, while in low-income countries the driving force was a rapid decline in infant and child mortality, leading to much larger numbers of surviving children. Over time these large cohorts are aging, adding first to the working-age population and later to the population of seniors. The oldest baby boomers are just reaching retirement age.
The baby boom ended in the 1960s, and fertility rates are now at low levels—in some cases, very low—in east Asia and Europe. The situation in the developing world is highly varied. Fertility rates have declined almost everywhere, but there are exceptions. In Africa the total fertility rate is just below 5 births per woman. In Asia, Pakistan’s fertility rate is 4, while in India and Bangladesh the rate is approaching 2. In China, by contrast, the fertility rate has declined to very low levels—about 1.5 births per woman.
Countries are aging at different rates:
• In lower-income countries, the dominant demographic trend is growth in the working-age population, while total dependency ratios are falling. This will continue to be the case for several more decades in countries like India and those in sub-Saharan Africa.
• In the richest countries, the dominant trend is growth in the older population. Although these populations have already aged considerably, the most challenging phase of population aging is yet to come, when the ratio of old people to those of working age—the so-called old-age dependency ratio—nearly doubles by 2050.
• In many emerging economies, the share of the working-age population is just now reaching a peak. In the coming decades, these countries will experience the population aging that high-income countries are already confronting. Ignoring these long-term trends may be tempting, but failing to respond now may take countries down an unwelcome and avoidable path of economic decline.
• Population aging is most advanced in the rich industrial nations, but it will also start soon and proceed rapidly in east Asia because of that region’s early and deep fertility declines. In south and southeast Asia, aging will come considerably later. The same is generally true in Latin America, but in some countries fertility is already low and population aging has begun. Fertility is still high in most of Africa and the Middle East, where population aging is still far in the future.
Economic life cycles
Changes in population age structure matter because economic activity varies in important and fundamental ways over a person’s life cycle. We consume from birth until death, but we only work for a limited portion of our lives, and over extended periods we consume much more than we produce.
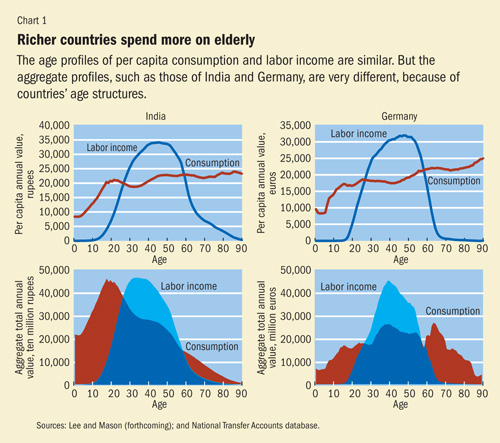
In most low- and middle-income countries, consumption is relatively low during childhood and rises to a plateau across all adult ages (see Chart 1, top panels).
In contrast, in many rich countries with well-developed welfare states, consumption rises strongly at older ages and increases particularly rapidly above age 85, but less so in Germany than in many other high-income countries. High consumption at older ages is largely driven by public and private spending on health and long-term care. Low labor income compounds the effects of high consumption by the elderly in rich countries. Workers tend to retire earlier in high-income nations partly because they can afford to but also because of the incentives and disincentives built into public and private pension plans, tax systems, and employment practices (Gruber and Wise, 1999).
In middle-income countries with generous public pension programs—such as Uruguay and Brazil—the elderly also have high consumption levels.
The aggregate life cycle depends on per capita consumption and labor income profiles combined with a population’s age distribution. It shows the total amounts consumed and produced by age in the national economy. The aggregate life cycle profile for a young country like India is very different from that of an older country like Germany (see Chart 1, lower panels).
The Indian profile is dominated by the life cycle deficit of children—the gap between what they consume and what they produce—while the deficit at older ages is relatively small, primarily because that population is a relatively small share of the total. Germany’s life cycle deficit at older ages is much larger, while children claim a smaller share of total resources than older Germans. The per capita life cycle profile plays a role here, but Germany’s population age structure is the real driver.
The transformation of the aggregate economic life cycle is fundamental to understanding the economic implications of the demographic transition. The enormous life cycle deficit for children in India leads to a very large downward flow from older age groups to younger age groups. In principle, children could borrow to pay for the gap between consumption and labor income. In practice, however, children rely on a combination of familial transfers from parents and grandparents and public transfers from taxpayers. In low- and middle-income countries, familial transfers are much greater than public transfers, so families directly bear the large costs that arise from such young populations.
The end of the demographic transition is marked by very large flows to older populations. These flows are very different from the downward flows to children, however. First, the family plays a much diminished role and the public sector plays a much more important role in upward transfers. Second, the life cycle deficit at old ages can be funded by the accumulation of assets—a retirement plan, personal savings, a home, consumer durables, a business, and so forth. While children are overwhelmingly dependent on older generations, older generations are not necessarily dependent on younger generations.
Getting help
Living standards are directly influenced by changes in a population’s age structure. If the number of workers (those who are contributing to national income) grows faster than the total population (those who are consuming), living standards go up.
Demographers refer to the number of workers divided by the total population as the support ratio. The more people there are of working age in a population, the higher the income per person, other things equal.
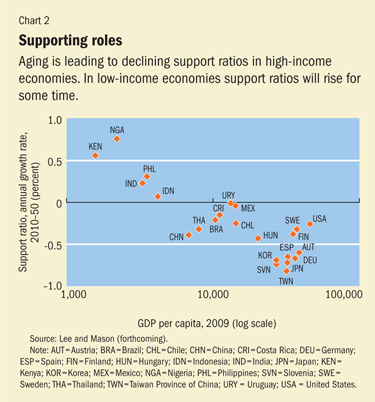
Until recently, support ratios were rising in most low- and high-income countries, which added to their economic growth. But population aging means support ratios are now declining in high-income countries (see Chart 2). In the coming decades, many poorer countries will also begin to experience declining support ratios.
Between 2010 and 2050 declining support ratios are expected to depress economic growth by 0.7 percent a year in Japan, Germany, and Spain and by 0.8 percent a year in Taiwan Province of China. In the United States, which is aging more slowly due to higher fertility, large net inflows of immigrants, and lower life expectancy, economic growth will be depressed by only 0.3 percent a year.
Changes in the support ratio may also curtail economic growth in China. Between 1972 and 2012 the support ratio is projected to increase by 0.8 percent a year, but is projected to decline by 0.4 percent a year between 2012 and 2050.
In many poor countries, however, where fertility began to decline later and has not proceeded as far, support ratios are rising and raising economic growth. In India, for example, the support ratio will continue to rise until 2040, and the net effect through 2050 will be to raise per capita income growth by 0.2 percent a year.
Who will pay the price?
Changes in the support ratio capture the first-round effects of population aging. But the full economic consequences depend on how a nation’s individuals, families, and governments plan for and respond to population aging.
One of the most important choices societies make is how to fund old-age consumption—by delaying retirement, by relying more on the family, by increasing public transfers to the elderly, or by accumulating more assets.
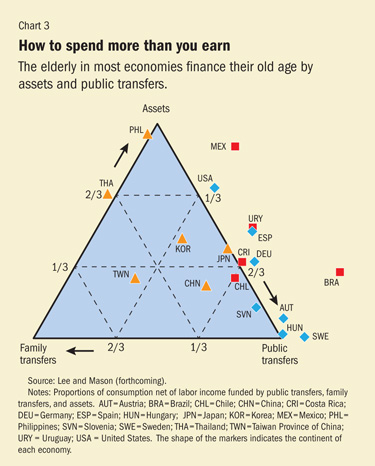
The life cycle deficit of the elderly—that is, the difference between what they consume and what they produce—is funded in a variety of ways (see Chart 3). The elderly in countries such as the Philippines near the apex labeled “Assets” fund the deficit almost entirely using assets. Those in countries such as Austria, Hungary, Slovenia, and Sweden near the vertex labeled “Public Transfers” fund their deficits through public pensions, public health care, and public long-term care. It is perhaps surprising that there are no countries near the “Family Transfers” vertex, since it is a common view that the elderly in poor traditional societies are supported by their adult children. As data become available for more than the 18 countries shown in the chart, it is possible that this picture will change. In any event, the figure shows that in some Asian economies such as Taiwan Province of China, Korea, and Thailand, the elderly do receive important support from their children in addition to other sources.
Countries on a line joining two vertices fund their deficits through a mixture of the two sources. We see that the elderly in most countries, including Japan, the United States, all countries in Europe, and some in Latin America, fund their deficits by some combination of assets and public transfers, and rely little on family transfers. In some countries that are far outside the triangle to the right, the elderly make large net transfers to their younger family members, as in Mexico and Brazil.
To the extent that elders fund their consumption by continuing to work, population aging raises dependency less and has a smaller effect on the support ratio. But the elderly rarely provide for more than a third of their total consumption through labor income, and the more they derive support from transfers—public or private—the less they work. When elders rely on their adult children for support, older populations mean fewer children to share the cost, so each child has a greater support burden on average. The situation is similar when elders rely on pay-as-you-go public pensions. In older populations, fewer workers pay the taxes that fund pension benefits for the elderly, so either taxes must be raised or benefits lowered.
When the elderly rely more heavily on their own accumulated assets, the burden on the younger generations is alleviated. Indeed, when the elderly hold a disproportionately large share of assets, population aging raises asset holdings per capita. In a closed economy this boosts the productivity of labor and wages but reduces the rate of return to capital. In an open economy, the assets will be invested abroad if domestic wages rise and profit rates fall, raising asset income in the home country. This tendency of population aging to raise the capital intensity of an economy or to generate increased asset income is known as the second dividend.
Population aging reduces the sustainable level of consumption, other things equal, as is shown by falling support ratios (see Chart 2). But other things will not be equal.
First, consider the second dividend. If the national saving rate remained the same, the slower labor force growth that accompanies population aging would mean more capital or asset income per worker, offsetting much of the increased support burden. Longer life may lead individuals and institutional pension providers to raise life cycle saving to provide for consumption during a longer retirement, unless they instead choose to work longer, which would offset the declines in the support ratio. Because people who have fewer children tend to spend more on themselves and want to continue spending at that level even after retirement, lower fertility may require higher savings. However, increased public or private transfer obligations might also cause national savings to decline.
If these various adjustments to labor supply and assets are not enough to offset the decline in the support ratio, other adjustments must be made. One option is to reduce consumption further, thereby increasing saving rates and assets. Another is to further increase labor effort, perhaps by postponing retirement in response to changing public pension incentives or in response to increased difficulty in funding retirement at the desired level from personal savings (see box).
Postponing retirement
Longer lives—adding years at the end of the life cycle, when most people are no longer working but are consuming heavily—mean countries’ consumption rises faster than income. But because health at older ages is generally improving, raising the retirement age can be an appealing option to help restore government budget balances.
How much longer would people have to work if the aim is to completely offset the decline in the support ratio between 2010 and 2050 through longer working lives alone?
In countries such as Mexico and Brazil, a very small net change in their support ratio (see Chart 2)—slight postponements of one and three years, respectively—would be sufficient. Such changes in the retirement age are politically feasible: people are living longer so it makes sense that they would also work longer. In countries that will see more aging in the next four decades, such as Finland, Sweden, and China, six years would be required, and seven for the United States. Countries that are aging most rapidly would require larger postponements: eight years for Japan, nine for Germany, and ten for Spain and Korea. For these countries especially, postponing retirement would need to be one of several steps.
Because aging in all these countries reflects not only longer life but also low fertility—which causes slower population growth—the increases in retirement age to offset population aging can be much larger or smaller than the simple projected increases in life expectancy.
Yet another possibility is to increase investment in the human capital of workers. Low fertility has been the main driver of population aging, and low fertility has been found, in theory and in empirical analysis, to go hand in hand with increased public and private investment in human capital per child (Lee and Mason, forthcoming, and 2010). In this case there are fewer workers but each is more productive.
Population aging will certainly challenge public and private budgets in many ways, but through a combination of reduced consumption, postponed retirement, increased asset holdings, and greater investment in human capital, it should be possible to meet this challenge without catastrophic consequences. ■
Ronald Lee is a Professor of Demography and Economics at the University of California, Berkeley, and Chair of the Center on the Economics and Demography of Aging. Andrew Mason is a Professor of Economics at the University of Hawaii and a Senior Fellow at the East-West Center.
References
Gruber, J. and D.A. Wise, 1999, “Introduction and Summary,” Social Security and Retirement around the World, ed. by J. Gruber and D.A. Wise (Chicago: University of Chicago Press), pp. 437–474.
Lee, Ronald, and Andrew Mason, forthcoming, Population Aging and the Generational Economy (Cheltenham and New York: Edward Elgar).
———, 2010, “Some Macroeconomic Aspects of Global Population Aging,” Demography, No. 47, Special Supplement, pp. S151–S172.
United Nations (UN), 2009, World Population Ageing, Department of Economic and Social Affairs, Population Division, Working Paper ESA/P/WP/212 (New York).

Write to us
F&D welcomes comments and brief letters, a selection of which are posted under Letters to the Editor. Letters may be edited. Please send your letters to fanddletters@imf.org