
Picture This
A History of World Debt
Finance & Development, March 2011, Vol. 48, No. 1
S. Ali Abbas, Nazim Belhocine, Asmaa El-Ganainy, and Mark Horton
How public debt has changed since 1880
THE global financial crisis has taken its toll on the world economy, especially on the public finances of advanced economies. As a share of GDP public debt has grown sharply in recent years—from 70 percent in 2000 to close to 100 percent in 2009. That sounds large. But how does it compare with debt levels over time? A new database from the International Monetary Fund—starting in 1880 for most advanced economies—offers a historical perspective.
The early period
During the first era of financial globalization (1880–1913), debt ratios in the advanced economies decreased—from 45 percent of GDP in 1880 to 29 percent of GDP in 1913. The gold standard that prevailed during this period was associated with unprecedented private capital inflows and trade flows, which spurred growth while lowering public debt ratios.
World Wars and the Great Depression
Debt reached its lowest ratio ever—23 percent of GDP—in 1914, when World War I began. But debt then began to climb. World War I (1914–18) and the fiscal crises that ensued produced a debt spike in advanced economies. Reductions in debt through the 1920s were followed by two further spikes linked to the Great Depression (early 1930s) and World War II (1941–45).
The ‘Great Peak’
During the Great Depression, the debt ratio peaked at 80 percent of GDP in 1932 following several episodes of banking and currency crises. The end of the Great Depression in the mid- to late 1930s was accompanied by debt reduction, but the start of World War II put an end to the deleveraging. With many countries borrowing extensively to finance war expenses, advanced economy indebtedness rose to the highest level recorded in the database: almost 150 percent of GDP in 1946.
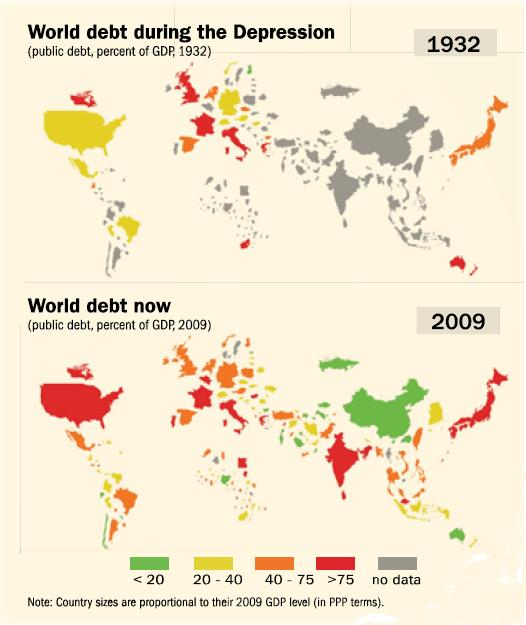
The recent crisis
While the impact on growth of the recent crisis is less dramatic than that of the Great Depression, the implications for public debt appear to be graver. That’s because the advanced economies were weaker at the outset of the current episode—with debt ratios 20 percentage points of GDP higher in advanced G-20 economies in 2007 than in 1928. In addition, the sharp drop in revenues (due to the collapse in economic activity, asset prices, and financial sector profits) and the cost of providing stimulus and financial sector support hit debt ratios harder during the recent crisis than during the Depression.
Prepared by S. Ali Abbas, Nazim Belhocine, Asmaa El-Ganainy, and Mark Horton of the IMF’s Fiscal Affairs Department. Text and graphics are based on “A Historical Public Debt Database”, published by the IMF in 2010. The underlying data are from The Historical Public Debt Database—which covers gross government debt-to-GDP ratios for 174 IMF member countries.

Write to us
F&D welcomes comments and brief letters, a selection of which are posted under Letters to the Editor. Letters may be edited. Please send your letters to fanddletters@imf.org