Their Cup Spilleth Over
Finance & Development, March 2010, Volume 47, Number 1
The U.S. and U.K. financial market crises had a spillover effect on the rest of the world, which explains the synchronized global slowdown
THE recent global crisis—the deepest and most widespread since the 1930s by any measure—has refocused attention on spillovers across countries. Did the size and nature of financial problems lead to a synchronized global downturn? Put another way, if we had anticipated the large U.S. (and U.K.) financial meltdown before the crisis, would we have predicted a synchronized global slowdown? There are good reasons to answer this question with a firm “yes.”
Identifying spillovers
Understanding international business cycles has always been tricky. We know that recessions and recoveries across countries are linked, especially with the U.S. cycle. But it is not easy to distinguish whether global shocks (such as oil price hikes) drive the U.S. business cycle or U.S. shocks (monetary policy and the like) drive global developments. The conventional wisdom that “when the U.S. economy sneezes, the rest of the world catches a cold” implies a line of causation from the United States to the rest of the global economy that has been difficult to verify statistically.
Moreover, deciphering the global web of business cycle linkages requires careful analysis of the relative importance of key trade, financial market, and commodity price links. In the past two decades, global trade volume has tripled, and the volume of cross-border financial flows has increased more than ninefold. But economists have generally not been good at distinguishing these different (and possibly interrelated) channels. The recent crisis clearly started in the U.S. financial sector. Are financial interrelationships so important that they dominate conventional trade channels across the major advanced economy regions?
A recent article (Bayoumi and Bui, 2010), extended the work of Bayoumi and Swiston (2009) to study spillovers of real gross domestic product (GDP) growth among the most advanced economic regions—the United States, the euro area, Japan, and the United Kingdom. Since we also wanted to model global shocks, we included an aggregate of smaller industrial countries with a wide range of structures and geographic locations, whose behavior might plausibly be thought to reflect global shocks. This work uses data from the early 1970s through late 2007 to identify the size of spillovers across these major regions and the channels that drive them. Regrettably, the starting date precludes using data for many emerging markets—including China. In addition, the euro area as such was formed only in the late 1990s, although the core continental European countries continued their long process of economic integration throughout the sample period.
We use an innovative methodology to identify the direction of causation by assessing how changes in the severity of between-country shocks over time correspond with more or fewer links between countries (Rigobon, 2003). Roughly put, if, say, U.S. shocks become larger than Japanese shocks at the same time U.S. growth becomes more closely linked with Japanese growth, it is assumed that most of the spillovers flow from the United States to Japan—the logic being that bigger U.S. shocks lead to higher observed correlations. Using a range of plausible changes in countries’ behavior allows us to estimate the degree of uncertainty associated with the detected direction of causation. By contrast, the traditional approach to this question must make assumptions about the direction of causation, rather than estimating such links from the data. Our results suggest that the crude assumptions made about the direction of causation in the traditional approach are rejected by the data. In addition, we can decompose the sources of cross-country spillovers into different channels by using variables that represent the possible channels for the cycle (the contribution of exports to U.S., euro area, and Japanese growth to measure trade links; changes in equity prices, bond yields, and short-term interest rates across these same regions to measure financial links; and oil and non-oil commodity prices for commodity links).
International spillovers: Which way and how big?
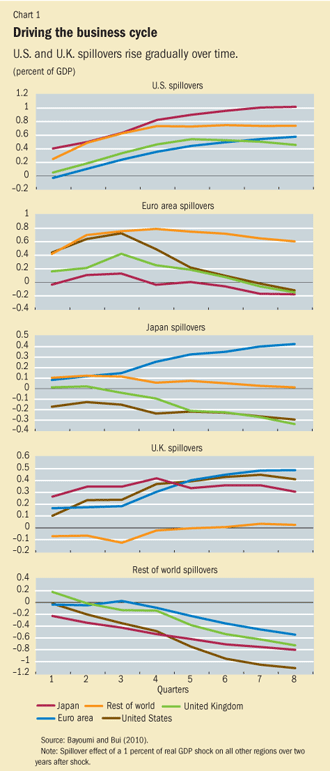
We calculated the size of spillovers on other regions resulting from a shock of 1 percent of real GDP in the United States, the euro area, Japan, the United Kingdom, and the rest of the world (see Chart 1). The first panel in the chart, which shows the impact on the other regions of a 1 percent of U.S. real GDP shock, suggests that U.S. shocks cause significant short-term spillovers that build gradually over time. After two years, such a shock raises real GDP in other regions by 0.4–1 percentage point, which represents significant spillover, given that the United States trades less internationally than do other countries. The spillovers are generally statistically significant even when the uncertainty associated with the direction of causation between regions is taken into account.
In contrast, euro area spillovers tend to start at a similar size to those of the United States but diminish and become insignificant (the rest-of-the-world group is an exception, to which we shall return). Japanese spillovers to the other regions are generally weak and insignificant, which is broadly consistent with the minimal impact on global growth of Japan’s “lost decade” of the 1990s. The remaining two regions show significant and rising spillovers over time, but of opposite signs. A positive shock to U.K. real GDP raises output elsewhere over time (except to the rest of the world). Intriguingly, the impact on the (much larger) euro area economy rises steadily over time. Hence, although the direction of short-term spillovers tends to be from the euro area to the United Kingdom, in the long term the opposite is true. Finally, higher output in the rest of the world tends to lead to lower activity in the other major regions.
Is there an intuitive explanation for this pattern of results? We believe there is. Note that the two regions with major financial centers produce positive spillovers that rise gradually over time. These are larger for the United States, which plays a greater role in global financial markets and has a bigger economy than the United Kingdom (indeed, given its highly internationalized financial system, much of the U.K. shock may well reflect global financial market conditions). By contrast, spillovers in the euro area, whose linkages with the other regions are largely based on trade, diminish over time; Japan, which is less open to trade than the euro area and has a limited presence as a financial center, has small spillovers.

Spillovers from the rest of the world (which includes several commodity producers, such as Australia, Canada, and New Zealand) seem to reflect mainly commodity price shocks. This would explain why positive shocks to real GDP in the rest of the world have negative spillovers elsewhere. It also explains why positive spillovers from the other regions to the rest of the world correspond roughly to those regions’ size in the world economy and hence their importance in commodity demand: spillovers are largest for the United States and the euro area, but negligible for the United Kingdom. In short, U.S. and U.K. financial shocks, together with commodity market surprises, seem to drive the global business cycle, with the euro area and Japan playing relatively minor roles.
We examine the plausibility of this interpretation of the international business cycle in two ways. First, we see how it explains the “Great Moderation”—the pervasive fall in macroeconomic volatility across a wide range of advanced economies—that occurred in the 1980s. Examining the results for the first and second halves of our sample, we find that the decrease in the size of U.S. and U.K. shocks is much larger than for the other areas (indeed, shocks in Japan increase over time). These results suggest that the Great Moderation reflected primarily smaller shocks in the two economies with major financial centers and that this provided a more stable environment for the rest of the world.
Where spillovers come from

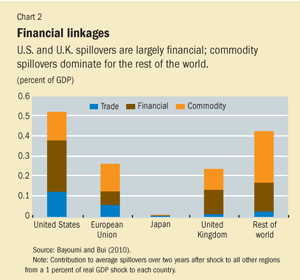
Our second test is to examine more directly the sources of spillovers to see if they correspond to our assumptions that the United States and the United Kingdom have relatively large financial linkages and that the rest of the world has relatively large commodity linkages. The results from this analysis are shown in Chart 2. The size of each bar represents the average size of spillovers (over two years) for each region—about one-half percent for the United States, four-tenths for the rest of the world, somewhat less for the euro area and the United Kingdom, and negligible for Japan. The euro area is a useful reference point because it has a relatively even split among financial, trade, and commodity spillovers. By contrast, in the United States and (in particular) the United Kingdom, financial market factors dominate; for the rest of the world, commodity factors lead. The identification of these links uses a completely separate approach from the one that estimates the size of spillovers, which provides important corroboration for our initial hypothesis that U.S. and U.K. spillovers are largely financial, but in the rest of the world they take place mainly through commodity markets.
Explaining the recent crisis
Our findings help explain the global nature of the boom over the 2000s and the severity of the ensuing global downturn. A series of positive shocks in the U.S. and U.K./global markets drove a global financial boom whose spillovers boosted growth in all major advanced economies. But that boom sowed the seeds of its own destruction, including through a synchronized set of commodity price hikes. When the financial excesses in the U.S. housing market started to deflate in late 2007, followed soon after by the U.K. housing market and global financial strains, these shocks eventually pulled down the advanced economies despite massive monetary and fiscal intervention. This confirms our premise that financial linkages are important and that financial shocks emanating from the United States and the United Kingdom have a major impact on the rest of the global economy.
That said, we freely admit that we cannot account for all the phenomena seen during the crisis. The recession’s exceptional synchronization owed much to the financial panic that followed the bankruptcy of U.S. investment bank Lehman Brothers and the resulting sudden stop in spending on highly traded consumer durables and investment goods, which led in turn to short but sharp trade spillovers (Kose, Otrok, and Prasad, 2010). But consistent with our results regarding the short-term impact of trade shocks on activity, the emerging markets that were linked to the advanced economies primarily through trade are indeed bouncing back rapidly; recovery in the advanced economies, with their more extensive financial links, is proving much slower and more painful.
Reference:
Bayoumi, Tamim, and Andrew Swiston, 2009, “Foreign Entanglements: Estimating the Source and Size of Spillovers across Industrial Countries,” IMF Staff Papers, Vol. 56, No. 2, pp. 353–83.-
Bayoumi, Tamim, and Trung Bui, 2010, “Deconstructing the International Business Cycle: Why Does a U.S. Sneeze Give the Rest of the World a Cold?” forthcoming IMF Working Paper (Washington: International Monetary Fund).-
Kose, M. Ayhan, Christopher Otrok, and Eswar Prasad, 2008, “How Much Decoupling? How Much Converging?” Finance & Development, Vol. 45, No. 2, pp. 36–40.
Rigobon, Roberto, 2003, “Identification through Heteroskedasticity,” The Review of Economics and Statistics, Vol. 85, No. 4, pp. 772–92.


