Out of the Ballpark
Finance & Development, June 2009, Volume 46, Number 2
M. Ayhan Kose, Prakash Loungani, and Marco E. Terrones
By any measure, the ongoing global recession is the deepest and the most synchronized of the postwar period
The U.S. baseball season culminates in a championship called the World Series, reflecting a time when the United States was the world when it came to baseball. Likewise, in the 1960s, a recession in the United States could just as well have been called a global recession. The United States accounted for a large share of world output, and cyclical activity in much of the rest of the world was dependent on U.S. conditions.
What constitutes a global recession today? Although advanced economies like the United States used to account for roughly 75 percent of world output in the 1960s, their share is now only about 55 percent. As a result, the coincidence between business cycles in advanced economies and global business cycles can no longer be taken for granted. At the same time, however, the countries of the world are more integrated today through trade and financial flows than they were in the 1960s. This creates greater potential for spillover and contagion effects, increasing the odds of synchronous movements and a global business cycle.
Surprisingly, there is no commonly accepted definition of a global recession. Under the definition we propose here—a contraction in world real per capita gross domestic product (GDP) accompanied by a broad decline in various other measures of global economic activity—there have been four global recessions in the post–World War II period: 1975, 1982, 1991, and 2009. The current recession is easily the most severe of the four: output—depending on the measure—is projected to fall between four and six times as much as it did on average in the three other global recessions, and unemployment is likely to increase twice as much. The collapse in world trade this year dwarfs that in past global recessions. And no previous global recession has had so many countries in a state of recession simultaneously. Put simply, in baseball parlance, this global recession is out of the ballpark.
Let’s date
In deciding when a particular country is in recession, economists often use statistical procedures to date the peaks and troughs of a key indicator of economic activity, such as the country’s real GDP. Applying the same idea at the global level since 1960, we use annual data on world real per capita GDP, using purchasing-power-parity (PPP) weights, from 1960 to 2010 (see Box 1). The estimates for 2009–10 are based on the latest IMF growth forecasts (International Monetary Fund, 2009). A per capita measure is used to account for the vast differences in population growth rates across countries. Emerging and developing economies tend to have faster GDP growth than industrialized economies, but they also have higher population growth.
Box 1 Valuing world GDP: PPP versus market rates
Countries report economic data in their own currencies. To make a cross-country comparison of those statistics (for example, GDP), the data must be converted into a common currency. Most economists do the conversion using either market exchange rates, usually the U.S. dollar rate, or purchasing-power-parity (PPP) exchange rates. The market approach converts currencies into the exchange rate prevailing in the open market. PPP calculates the rate at which the currency of one country would have to be converted into another to buy the same assortment of goods and services. PPP, which is harder to calculate, reflects the fact that goods and services that are not traded internationally tend to be cheaper in low-income countries than in higher-income countries. As a result, the value of, say, output in low-income countries tends to be higher using PPP rather than market rates.
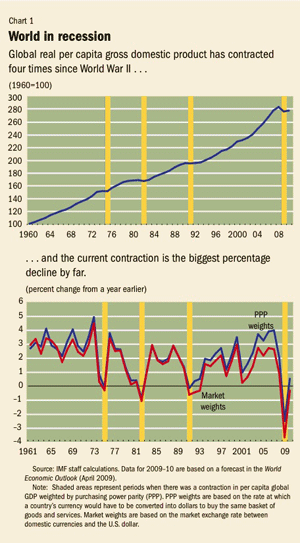
The procedure picks out four troughs in global economic activity over the past 50 years—1975, 1982, 1991, and 2009. These correspond to declines in world real per capita GDP (see Chart 1, top panel). What major events took place during these  episodes?
The global recession of 1975 followed a sharp increase in oil prices, which shot up fourfold in a short time following the Arab oil embargo that began in 1973. This recession marked the beginning of a prolonged period of stagflation, with low output growth and high inflation in the United States.
The recession in 1982 was associated with a variety of events, including tight monetary policies in several advanced economies, the rapid increase in oil prices, and the debt crisis experienced by a number of Latin American countries.
The 1991 recession reflected a host of problems in various corners of the world: difficulties in the U.S. saving and loan industry, banking crises in several Scandinavian economies, adverse effects of an exchange rate crisis on a large number of European countries, challenges faced by the east European transition economies, and the uncertainty stemming from the Gulf War and the subsequent increase in the price of oil.
There is little substantive impact on the analysis if market weights, which enhance the importance of advanced economies, are used rather than PPP weights. With market weights, the trough of the 1991 episode shifts to 1993 because of the downturns in many European countries during the exchange rate mechanism crisis of 1992–93. Using either weight, current projections suggest that the 2009 global recession will be by far the deepest recession in five decades (see Chart 1, bottom panel). If total, rather than real per capita GDP is used, 2009 would be the only year since 1960 in which there has been a contraction in the global economy.
A second look
In 1978, the U.S. National Bureau of Economic Research (NBER) established a Dating Committee, tasked with determining the dates of recessions in the United States. A similar task for the euro area has been performed by the Centre for Economic Policy Research (CEPR) since 2002.
In contrast to a purely statistical approach, the NBER and CEPR, both private institutions, date business cycle peaks and troughs by looking at a broad set of macroeconomic indicators and reaching a judgment on whether a preponderance of the evidence points to a recession. Because indicators can exhibit conflicting signals about the direction of an economy, this judgmental approach is difficult to employ in real time.
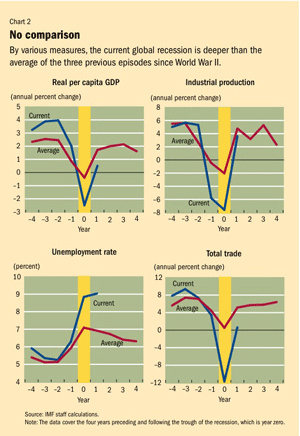
We apply this approach at the global level by using several indicators of global activity—real per capita GDP, industrial production, trade, capital  flows, oil consumption, and unemployment (although unemployment data are available only for a small set of economies). The judgmental method reassuringly yields the same dates for global recessions as the statistical approach (see Chart 2).
Around the global recessions of 1975, 1982, and 1991, world industrial production and oil consumption start to slow down two years before, and world trade and capital flows one year before, the trough. The unemployment rate registers its sharpest increase in the year of the recession. Similar to its behavior in national recessions, unemployment remains high in the year after the trough, whereas most other indicators have recovered to close to their normal rates of growth. The ongoing recession is following a pattern similar to that observed in past recessions, although the contractions in most indicators are much sharper this time.
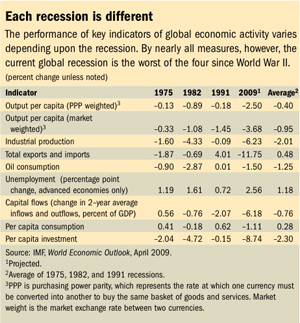
 This point is reinforced by an analysis of the quantitative features of global recessions (see table). No two global recessions are exactly alike. There are sharper declines in almost all indicators in 1975 and 1982 than in 1991; in 1991, in fact, world trade grew strongly despite the recession. In addition, although both world industrial production and oil consumption stayed flat during the 1991 episode, both indicators fell significantly in the earlier global recessions. In several instances, world economic performance was shaky, but conditions were not severe enough to warrant assigning those years a label of global recession (see Box 2).
Box 2 Close, but no global recession
To many parts of the world, 1998 and 2001 felt like a recession. However, neither the statistical method nor the judgmental approach suggests that in either year the world was in a recession. The statistical method does not pick them out, because world real per capita GDP did not contract in these years. In 1997–98, many emerging economies, particularly in Asia, had sharp declines in economic activity, but growth in advanced economies held up. In 2001, conversely, many advanced economies had mild recessions, but growth in major emerging markets, such as China and India, remained robust.
Moreover, the behavior of the broad set of global macroeconomic indicators was mixed during the years 1998 and 2001, supporting the inference from the statistical method that these episodes did not display the features of a global recession. For example, the indicators did not suggest a broad-based weakness in the global economy in 1998. In 2001, although industrial production did fall and the rate of global unemployment picked up slightly, both global trade flows and oil consumption increased.
There is no question about the severity of present conditions, though. The ongoing global recession is rewriting the book on global recessions of the past 50 years. The immense impact of the global financial crisis on the real economy is evident from the sharp contraction in global industrial production and the rapid escalation of global unemployment. Although the projected decline in industrial production is more than 6 percent, unemployment is expected to increase by about 2.5 percentage points during the current recession. These changes would be much larger than those in the earlier recessions.
Trade and financial flows collapsed
The collapse of global trade and capital flows projected for 2009 is particularly striking. Although the globalization of national manufacturing chains has been a major force driving the growth of world trade during the past two decades, the same process is now instrumental in the sharp contraction of cross-border trade flows. The projected decline in global trade during this episode dwarfs those in 1975 and 1982. After overshadowing the growth of global trade flows over the past two decades, global capital flows reached unprecedented levels in 2007. However, these flows rapidly dried up in the last quarter of 2008, as the global financial crisis spread from advanced economies to emerging markets and developing countries. Global capital flows registered large declines in 1982 and 1991, but those changes are much smaller than the massive decline that seems to be occurring during the current episode.
The severity of the 2009 recession is also indicated by the expected deterioration in per capita consumption, which is much greater than that observed in 1982 and in contrast to the increase in consumption during the two other global recessions. Per capita investment fell in all global recessions, but the projected decline in the present recession easily exceeds that observed in the previous episodes. Just as national recessions associated with financial stress episodes tend to be deeper than other recessions, global recessions coinciding with worldwide financial crises appear to take a heavy toll on the real economy.
Synchronicity of national recessions
How synchronized are national recessions around episodes of global recessions? Not surprisingly, the percentage of countries in recession went up sharply during the four global recessions. The synchronization is measured by yearly fluctuations in the GDP-weighted fraction of countries that have experienced a decline in real per capita GDP. Although the 1975 recession was driven largely by declines in industrialized countries, emerging and developing countries have played a role in the other three episodes. In 1982, recessions in many Latin American countries contributed to the decline in global activity, whereas in 1991 declines in the transition economies played an important role. The 1991 recession was a multiyear episode in which the U.S. recession in 1990–91 was followed by recessions among European countries during the exchange rate crisis.
The period 2006–07 stands out as one in which the number of countries in recession was at a historical low. However, it has been followed by a sharp reversal in fortune. In 2009, all the advanced economies and roughly half the emerging market and developing countries are expected to be in recession. This degree of synchronicity of the current recession to date is the highest over the past half century. Even though it is clearly driven by sharp declines in activity in the advanced economies, recessions in a number of emerging and developing countries are contributing to its depth and synchronicity.
The worst by any reckoning
The 2009 forecasts of a 2.5 percent decline in world real per capita GDP, if realized, would qualify this year as the most severe global recession of the postwar period. Almost all indicators of economic activity are expected to register sharper declines than in previous episodes of global recession. In addition to its severity, this global recession also qualifies as the most synchronized—all the advanced economies are in recession, and many emerging and developing economies are as well.
Reference:
International Monetary Fund, 2009, World Economic Outlook (Washington, April).


