Table
2. Debt Service for Individual HIPCs
that Reached Decision Points,
by Country, 1998-2005
(In million of US dollars, unless
otherwise indicated)
|
|
|
1998
|
1999
|
2000
|
2001
|
2002
|
2003
|
2004
|
2005
|
|
| Benin
|
|
|
|
|
|
|
|
|
| Debt
service paid |
64 |
66 |
|
|
|
|
|
|
| Debt
service due after enhanced HIPC Initiative relief1
|
|
|
63 |
46 |
43 |
39 |
39 |
37 |
| Debt
service/exports (in percent) |
16 |
17 |
17 |
11 |
9 |
8 |
7 |
6 |
| Debt
service/government revenue (in percent)
|
17 |
18 |
12 |
10 |
8 |
7 |
6 |
5 |
| Debt
service/GDP (in percent) |
3 |
3 |
3 |
2 |
1 |
1 |
1 |
1 |
|
| Bolivia
|
|
|
|
|
|
|
|
|
| Debt
service paid |
390 |
250 |
|
|
|
|
|
|
| Debt
service due after enhanced HIPC Initiative relief1
|
|
|
260 |
225 |
238 |
234 |
235 |
266 |
| Debt
service/exports (in percent) |
29 |
20 |
18 |
14 |
14 |
12 |
11 |
12 |
| Debt
service/government revenue (in percent)
|
19 |
13 |
14 |
11 |
12 |
11 |
10 |
10 |
| Debt
service/GDP (in percent) |
5 |
3 |
3 |
3 |
3 |
2 |
2 |
2 |
|
| Burkina
Faso |
|
|
|
|
|
|
|
|
| Debt
service paid |
60 |
53 |
|
|
|
|
|
|
| Debt
service due after enhanced HIPC Initiative relief1
|
|
|
34 |
30 |
35 |
38 |
40 |
41 |
| Debt
service/exports (in percent) |
16 |
18 |
12 |
9 |
10 |
9 |
9 |
8 |
| Debt
service/government revenue (in percent)
|
18 |
14 |
9 |
7 |
7 |
7 |
7 |
6 |
| Debt
service/GDP (in percent) |
2 |
2 |
1 |
1 |
1 |
1 |
1 |
1 |
|
| Cameroon2
|
|
|
|
|
|
|
|
|
| Debt
service paid3 |
401 |
401 |
312 |
|
|
|
|
|
| Debt
service due after enhanced HIPC Initiative relief1
|
|
|
|
226 |
242 |
291 |
328 |
347 |
| Debt
service/exports (in percent) |
18 |
15 |
11 |
8 |
8 |
9 |
9 |
9 |
| Debt
service/government revenue (in percent)
|
28 |
24 |
18 |
12 |
12 |
13 |
13 |
12 |
| Debt
service/GDP (in percent) |
4 |
4 |
3 |
2 |
2 |
3 |
3 |
3 |
|
| Chad
|
|
|
|
|
|
|
|
|
| Debt
service paid4 |
38 |
39 |
33 |
|
|
|
|
|
| Debt
service due after enhanced HIPC Initiative relief1
|
|
|
|
22 |
25 |
25 |
32 |
36 |
| Debt
service/exports (in percent) |
12 |
16 |
14 |
9 |
9 |
9 |
8 |
2 |
| Debt
service/government revenue (in percent)
|
29 |
31 |
29 |
16 |
16 |
14 |
15 |
11 |
| Debt
service/GDP (in percent) |
2 |
3 |
2 |
1 |
1 |
1 |
2 |
1 |
|
| Gambia,
The |
|
|
|
|
|
|
|
|
| Debt
service paid3 |
26 |
16 |
20 |
|
|
|
|
|
| Debt
service due after enhanced HIPC Initiative relief1
|
|
|
|
16 |
15 |
8 |
9 |
10 |
| Debt
service/exports (in percent) |
12 |
13 |
16 |
11 |
10 |
5 |
5 |
5 |
| Debt
service/government revenue (in percent)
|
12 |
20 |
23 |
17 |
15 |
8 |
8 |
9 |
| Debt
service/GDP (in percent) |
6 |
4 |
5 |
4 |
3 |
2 |
2 |
2 |
|
| Guinea
|
|
|
|
|
|
|
|
|
| Debt
service paid3 |
128 |
108 |
140 |
|
|
|
|
|
| Debt
service due after enhanced HIPC Initiative relief1
|
|
|
|
78 |
90 |
99 |
92 |
88 |
| Debt
service/exports (in percent) |
15 |
14 |
16 |
8 |
9 |
9 |
8 |
7 |
| Debt
service/government revenue (in percent)
|
34 |
28 |
39 |
18 |
18 |
18 |
15 |
12 |
| Debt
service/GDP (in percent) |
4 |
4 |
5 |
3 |
3 |
3 |
3 |
2 |
|
| Guinea-Bissau
|
|
|
|
|
|
|
|
|
| Debt
service paid3 |
7 |
6 |
13 |
|
|
|
|
|
| Debt
service due after enhanced HIPC Initiative relief1
|
|
|
|
5 |
6 |
8 |
5 |
4 |
| Debt
service/exports (in percent) |
23 |
11 |
18 |
6 |
7 |
8 |
4 |
3 |
| Debt
service/government revenue (in percent)
|
63 |
15 |
32 |
11 |
12 |
13 |
7 |
5 |
| Debt
service/GDP (in percent) |
3 |
3 |
6 |
2 |
2 |
2 |
2 |
1 |
|
| Guyana
|
|
|
|
|
|
|
|
|
| Debt
service paid3 |
131 |
70 |
|
|
|
|
|
|
| Debt
service due after enhanced HIPC Initiative relief1
|
|
|
74 |
48 |
34 |
39 |
42 |
43 |
| Debt
service/exports (in percent) |
19 |
10 |
10 |
6 |
4 |
5 |
5 |
5 |
| Debt
service/government revenue (in percent)
|
65 |
32 |
31 |
19 |
13 |
13 |
14 |
13 |
| Debt
service/GDP (in percent) |
18 |
10 |
10 |
6 |
5 |
5 |
5 |
5 |
|
| Honduras
|
|
|
|
|
|
|
|
|
| Debt
service paid |
311 |
241 |
|
|
|
|
|
|
| Debt
service due after enhanced HIPC Initiative relief1
|
|
|
167 |
134 |
210 |
276 |
247 |
258 |
| Debt
service/exports (in percent) |
13 |
10 |
6 |
4 |
6 |
7 |
6 |
5 |
| Debt
service/government revenue (in percent)
|
32 |
23 |
15 |
10 |
14 |
16 |
13 |
12 |
| Debt
service/GDP (in percent) |
6 |
4 |
3 |
2 |
3 |
4 |
3 |
3 |
|
| Madagascar5
|
|
|
|
|
|
|
|
|
| Debt
service paid3 |
166 |
106 |
105 |
|
|
|
|
|
| Debt
service due after enhanced HIPC Initiative relief1
|
|
|
|
64 |
56 |
68 |
79 |
82 |
| Debt
service/exports (in percent) |
21 |
12 |
11 |
6 |
5 |
5 |
6 |
5 |
| Debt
service/government revenue (in percent)
|
42 |
25 |
21 |
12 |
9 |
10 |
10 |
9 |
| Debt
service/GDP (in percent) |
4 |
3 |
3 |
2 |
1 |
1 |
1 |
1 |
|
| Malawi
|
|
|
|
|
|
|
|
|
| Debt
service paid3 |
90 |
87 |
110 |
|
|
|
|
|
| Debt
service due after enhanced HIPC Initiative relief1
|
|
|
|
59 |
57 |
45 |
45 |
47 |
| Debt
service/exports (in percent) |
16 |
18 |
23 |
12 |
11 |
8 |
8 |
8 |
| Debt
service/government revenue (in percent)
|
22 |
30 |
31 |
13 |
11 |
8 |
7 |
6 |
| Debt
service/GDP (in percent) |
5 |
5 |
6 |
4 |
3 |
2 |
2 |
2 |
|
| Mali
|
|
|
|
|
|
|
|
|
| Debt
service paid |
74 |
84 |
|
|
|
|
|
|
| Debt
service due after enhanced HIPC Initiative relief1
|
|
|
88 |
64 |
64 |
66 |
67 |
66 |
| Debt
service/exports (in percent) |
11 |
13 |
14 |
9 |
8 |
8 |
7 |
7 |
| Debt
service/government revenue (in percent)
|
17 |
18 |
20 |
13 |
12 |
11 |
10 |
9 |
| Debt
service/GDP (in percent) |
3 |
3 |
3 |
2 |
2 |
2 |
2 |
2 |
|
| Mauritania
|
|
|
|
|
|
|
|
|
| Debt
service paid |
88 |
98 |
|
|
|
|
|
|
| Debt
service due after enhanced HIPC Initiative relief1
|
|
|
87 |
80 |
58 |
49 |
43 |
43 |
| Debt
service/exports (in percent) |
22 |
24 |
20 |
18 |
13 |
10 |
8 |
8 |
| Debt
service/government revenue (in percent)
|
35 |
35 |
22 |
20 |
14 |
10 |
8 |
8 |
| Debt
service/GDP (in percent) |
10 |
10 |
9 |
9 |
6 |
4 |
3 |
3 |
|
| Mozambique
|
|
|
|
|
|
|
|
|
| Debt
service paid |
104 |
81 |
|
|
|
|
|
|
| Debt
service due after enhanced HIPC Initiative relief1
|
|
|
50 |
48 |
51 |
54 |
55 |
60 |
| Debt
service/exports (in percent) |
19 |
14 |
9 |
6 |
4 |
4 |
4 |
4 |
| Debt
service/government revenue (in percent)
|
23 |
17 |
9 |
8 |
7 |
7 |
6 |
6 |
| Debt
service/GDP (in percent) |
3 |
2 |
1 |
1 |
1 |
1 |
1 |
1 |
|
| Nicaragua
|
|
|
|
|
|
|
|
|
| Debt
service paid3 |
198 |
108 |
126 |
|
|
|
|
|
| Debt
service due after enhanced HIPC Initiative relief1 6
|
|
|
|
117 |
188 |
153 |
123 |
127 |
| Debt
service/exports (in percent) |
24 |
13 |
13 |
11 |
17 |
12 |
9 |
9 |
| Debt
service/government revenue (in percent)
|
37 |
19 |
20 |
16 |
26 |
21 |
13 |
12 |
| Debt
service/GDP (in percent) |
9 |
5 |
6 |
5 |
7 |
5 |
4 |
4 |
|
| Niger
|
|
|
|
|
|
|
|
|
| Debt
service paid3 |
27 |
28 |
20 |
|
|
|
|
|
| Debt
service due after enhanced HIPC Initiative relief1
|
|
|
|
49 |
49 |
26 |
29 |
29 |
| Debt
service/exports (in percent) |
7 |
9 |
8 |
18 |
17 |
8 |
9 |
8 |
| Debt
service/government revenue (in percent)
|
15 |
16 |
13 |
27 |
24 |
11 |
11 |
10 |
| Debt
service/GDP (in percent) |
1 |
1 |
1 |
2 |
2 |
1 |
1 |
1 |
|
| Rwanda
|
|
|
|
|
|
|
|
|
| Debt
service paid3 |
14 |
21 |
40 |
|
|
|
|
|
| Debt
service due after enhanced HIPC Initiative relief1
|
|
|
|
16 |
13 |
8 |
11 |
11 |
| Debt
service/exports (in percent) |
13 |
19 |
31 |
11 |
8 |
4 |
5 |
4 |
| Debt
service/government revenue (in percent)
|
7 |
11 |
21 |
8 |
6 |
3 |
4 |
3 |
| Debt
service/GDP (in percent) |
1 |
1 |
2 |
1 |
1 |
0 |
0 |
0 |
|
| São
Tomé and Príncipe |
|
|
|
|
|
|
|
|
| Debt
service paid3 |
7 |
8 |
6 |
|
|
|
|
|
| Debt
service due after enhanced HIPC Initiative relief1
|
|
|
|
2 |
1 |
1 |
1 |
1 |
| Debt
service/exports (in percent) |
55 |
24 |
24 |
10 |
6 |
6 |
4 |
3 |
| Debt
service/government revenue (in percent)
|
84 |
44 |
41 |
17 |
10 |
10 |
6 |
6 |
| Debt
service/GDP (in percent) |
16 |
17 |
13 |
4 |
3 |
2 |
2 |
2 |
|
| Senegal
|
|
|
|
|
|
|
|
|
| Debt
service paid |
222 |
219 |
|
|
|
|
|
|
| Debt
service due after enhanced HIPC Initiative relief1
|
|
|
173 |
159 |
145 |
143 |
225 |
134 |
| Debt
service/exports (in percent) |
14 |
15 |
10 |
8 |
7 |
7 |
10 |
5 |
| Debt
service/government revenue (in percent)
|
27 |
28 |
19 |
16 |
14 |
12 |
18 |
10 |
| Debt
service/GDP (in percent) |
5 |
5 |
3 |
3 |
2 |
2 |
3 |
2 |
|
| Tanzania2
|
|
|
|
|
|
|
|
|
| Debt
service paid |
224 |
193 |
|
|
|
|
|
|
| Debt
service due after enhanced HIPC Initiative relief1
|
|
|
154 |
142 |
144 |
148 |
152 |
158 |
| Debt
service/exports (in percent)
|
21 |
16 |
12 |
10 |
8 |
8 |
7 |
7 |
| Debt
service/government revenue (in percent)
|
29 |
20 |
15 |
12 |
11 |
11 |
10 |
9 |
| Debt
service/GDP (in percent) |
3 |
2 |
2 |
1 |
1 |
1 |
1 |
1 |
|
| Uganda2
|
|
|
|
|
|
|
|
|
| Debt
service paid |
110 |
98 |
|
|
|
|
|
|
| Debt
service due after enhanced HIPC Initiative relief1
|
|
|
48 |
51 |
56 |
68 |
94 |
103 |
| Debt
service/exports (in percent)
|
15 |
12 |
11 |
6 |
6 |
6 |
6 |
8 |
| Debt
service/government revenue (in percent)
|
16 |
13 |
11 |
6 |
5 |
5 |
5 |
6 |
| Debt
service/GDP (in percent) |
2 |
2 |
1 |
1 |
1 |
1 |
1 |
1 |
|
| Zambia
|
|
|
|
|
|
|
|
|
| Debt
service paid3 |
147 |
136 |
169 |
|
|
|
|
|
| Debt
service due after enhanced HIPC Initiative relief1
|
|
|
|
158 |
148 |
151 |
211 |
202 |
| Debt
service/exports (in percent)
|
16 |
16 |
16 |
13 |
10 |
10 |
13 |
12 |
| Debt
service/government revenue (in percent)
|
24 |
25 |
26 |
25 |
21 |
20 |
27 |
24 |
| Debt
service/GDP (in percent) |
5 |
4 |
5 |
5 |
4 |
4 |
5 |
4 |
|
| Total
debt service paid7 |
3,027 |
2,518 |
1,093 |
|
|
|
|
|
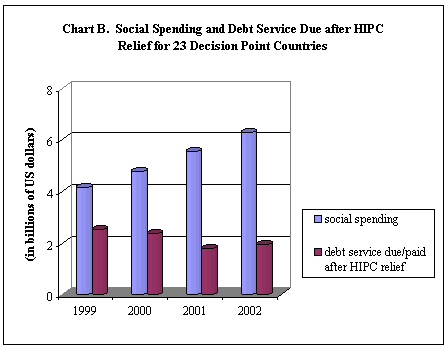
| Total
debt service due1
|
|
|
1,197 |
1,838 |
1,968 |
2,035 |
2,201 |
2,194 |
| Ratio
of debt service to exports (in percent)
|
|
|
|
|
|
|
|
|
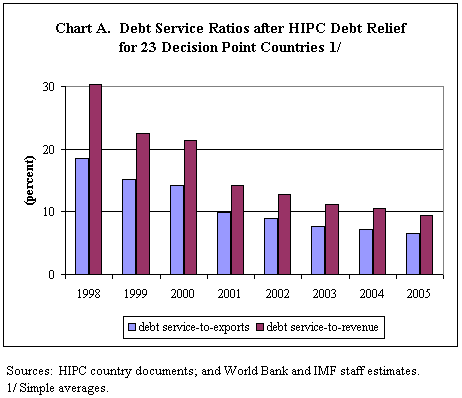
| Simple average
|
19
|
15
|
14
|
10
|
9
|
8
|
7
|
7
|
|
Weighted average |
17
|
14
|
12
|
9
|
8
|
8
|
8
|
7
|
| Ratio
of debt service to government revenue (in percent) |
|
|
|
|
|
|
|
|
| Simple average
|
30
|
23
|
21
|
14
|
13
|
11
|
10
|
9
|
|
Weighted average |
26
|
21
|
18
|
13
|
12
|
11
|
11
|
10
|
| Ratio
of debt service to GDP (in percent)
|
|
|
|
|
|
|
|
|
| Simple average
|
5
|
4
|
4
|
3
|
3
|
2
|
2
|
2
|
|
Weighted average |
4
|
3
|
3
|
2
|
2
|
2
|
2
|
2
|
Sources: HIPC country
documents; and World Bank and IMF staff
estimates.
1Debt service due after the
full use of traditional debt relief mechanism
and assistance under the enhanced HIPC
initiative.
2On fiscal year basis, i.e.
2000 column shows FY 2000/2001.
3The debt service figure for
2000 largely reflects pre-HIPC relief
debt service because these countries
did not reach their decision point until
late in 2000. Thus, the full impact of
relief for these countries will not be
felt until 2001 and thereafter.
4Debt service for 2000 is
pre-HIPC, as Chad reached its decision
point in May 2001.
5The assistance for Madagascar
is indicative and subject to change.
Following the Bank's Board meeting, staff
were informed that the Madagasy authorities
and Paris Club creditors would need to
revisit the outstanding bilateral debt
numbers. Also, minor adjustments need
to be incorporated in the case of three
multilateral creditors. Consequently,
the IMF Board approved US$790 million
in HIPC assistance, with the understanding
that Madagascar's total HIPC assistance
will be determined as a result of the
expected revisions mentioned above.
6Debt service due in 2002/03
reflects a hypothetical assumption that
arrears to non-Paris Club creditors (about
US$2 billion) would be regularized and
serviced. It also reflects the resumption
of payments to the Paris Club creditors
that had provided a total deferral of
debt service in the wake of Hurricane
Mitch in 1998.
7Debt service for 2000 is
largely pre-HIPC, as 12 of the 23 countries
did not reach their decision point until
December 2000 or later. See footnotes
3 and 4.
Note: Debt service figures for 1998 and
1999 reflect debt relief already provided
to Bolivia, Guyana, Mozambique, and Uganda
under the original framework. |
Table
4. Social Expenditure for Individual
HIPCs that Reached Decision Points,
by Country1
(In millions of US dollars)
|
|
|
1999
|
2000
|
2001
|
2002
|
|
| Benin
|
|
|
|
|
| Social
Expenditure |
115
|
148
|
195
|
2142
|
| Social
Expenditure/Government Revenue (in percent)
|
31
|
36
|
39
|
39
|
| Social
Expenditure/GDP (in percent)
|
5
|
6
|
7
|
7
|
|
Burkina
Faso |
|
|
|
|
| Social
Expenditure |
141
|
142
|
165
|
192
|
| Social
Expenditure/Government Revenue (in percent) |
36
|
37
|
39
|
40
|
| Social
Expenditure/GDP (in percent)
|
5
|
5
|
6
|
6
|
|
| Bolivia
|
|
|
|
|
| Social
Expenditure |
839
|
872
|
941
|
1,0862
|
| Social
Expenditure/Government Revenue (in percent)
|
43
|
46
|
47
|
52
|
| Social
Expenditure/GDP (in percent)
|
10
|
10
|
11
|
12
|
|
| Cameroon
|
|
|
|
|
| Social
Expenditure |
264
|
316
|
389
|
451
|
| Social
Expenditure/Government Revenue (in percent)
|
16
|
18
|
21
|
22
|
| Social
Expenditure/GDP (in percent)
|
3
|
3
|
4
|
4
|
|
| Chad
|
|
|
|
|
| Social
Expenditure |
63
|
65
|
75
|
87
|
| Social
Expenditure/Government Revenue (in percent)
|
50
|
58
|
54
|
56
|
| Social
Expenditure/GDP (in percent)
|
5
|
5
|
5
|
5
|
|
| The
Gambia |
|
|
|
|
| Social
Expenditure |
23
|
26
|
30
|
34
|
| Social
Expenditure/Government Revenue (in percent)
|
29
|
30
|
33
|
35
|
| Social
Expenditure/GDP (in percent)
|
5
|
6
|
7
|
7
|
|
| Guinea
|
|
|
|
|
| Social
Expenditure |
101
|
105
|
109
|
1202
|
| Social
Expenditure/Government Revenue (in percent)
|
26
|
30
|
29
|
29
|
| Social
Expenditure/GDP (in percent)
|
4
|
3
|
3
|
3
|
|
| Guinea-Bissau
|
|
|
|
|
| Social
Expenditure |
26
|
30
|
42
|
47
|
| Social
Expenditure/Government Revenue (in percent)
|
66
|
74
|
89
|
87
|
| Social
Expenditure/GDP (in percent)
|
12
|
13
|
17
|
16
|
|
| Guyana
|
|
|
|
|
| Social
Expenditure |
77
|
101
|
106
|
114
|
| Social
Expenditure/Government Revenue (in percent)
|
35
|
42
|
42
|
42
|
| Social
Expenditure/GDP (in percent)
|
11
|
14
|
14
|
15
|
|
| Honduras
|
|
|
|
|
| Social
Expenditure |
442
|
685
|
721
|
844
|
| Social
Expenditure/Government Revenue (in percent)
|
42
|
60
|
54
|
55
|
| Social
Expenditure/GDP (in percent)
|
8
|
12
|
12
|
13
|
|
| Madagascar
|
|
|
|
|
| Social
Expenditure |
156
|
188
|
223
|
277
|
| Social
Expenditure/Government Revenue (in percent)
|
37
|
38
|
41
|
45
|
| Social
Expenditure/GDP (in percent)
|
4
|
5
|
5
|
6
|
|
| Malawi
|
|
|
|
|
| Social
Expenditure |
99
|
118
|
143
|
161
|
| Social
Expenditure/Government Revenue (in percent)
|
34
|
33
|
32
|
32
|
| Social
Expenditure/GDP (in percent)
|
5
|
7
|
9
|
10
|
|
| Mali
|
|
|
|
|
| Social
Expenditure |
83
|
98
|
115
|
126
|
| Social
Expenditure/Government Revenue (in percent)
|
18
|
22
|
24
|
23
|
| Social
Expenditure/GDP (in percent)
|
3
|
4
|
4
|
4
|
|
| Mauritania
|
|
|
|
|
| Social
Expenditure |
85
|
97
|
111
|
121
|
| Social
Expenditure/Government Revenue (in percent)
|
30
|
34
|
37
|
38
|
| Social
Expenditure/GDP (in percent)
|
8
|
8
|
9
|
9
|
|
| Mozambique
|
|
|
|
|
| Social
Expenditure |
158
|
161
|
173
|
203
|
| Social
Expenditure/Government Revenue (in percent)
|
32
|
30
|
29
|
30
|
| Social
Expenditure/GDP (in percent)
|
4
|
4
|
4
|
4
|
|
| Nicaragua
|
|
|
|
|
| Social
Expenditure |
267
|
374
|
506
|
594
|
| Social
Expenditure/Government Revenue (in percent)
|
47
|
59
|
71
|
83
|
| Social
Expenditure/GDP (in percent)
|
12
|
15
|
19
|
20
|
|
| Niger
|
|
|
|
|
| Social
Expenditure |
99
|
85
|
112
|
132
|
| Social
Expenditure/Government Revenue (in percent)
|
58
|
55
|
62
|
64
|
| Social
Expenditure/GDP (in percent)
|
5
|
4
|
6
|
6
|
|
| Rwanda
|
|
|
|
|
| Social
Expenditure |
75
|
73
|
89
|
108
|
| Social
Expenditure/Government Revenue (in percent)
|
40
|
39
|
45
|
47
|
| Social
Expenditure/GDP (in percent)
|
4
|
4
|
5
|
6
|
|
| São
Tomé and Príncipe
|
|
|
|
|
| Social
Expenditure |
8
|
8
|
9
|
12
|
| Social
Expenditure/Government Revenue (in percent)
|
93
|
77
|
76
|
86
|
| Social
Expenditure/GDP (in percent)
|
17
|
17
|
20
|
22
|
|
| Senegal
|
|
|
|
|
| Social
Expenditure |
257
|
258
|
277
|
3012
|
| Social
Expenditure/Government Revenue (in percent)
|
33
|
29
|
29
|
28
|
| Social
Expenditure/GDP (in percent)
|
6
|
5
|
5
|
5
|
|
| Tanzania
|
|
|
|
|
| Social
Expenditure |
289
|
327
|
361
|
379
|
| Social
Expenditure/Government Revenue (in percent)
|
30
|
31
|
30
|
30
|
| Social
Expenditure/GDP (in percent)
|
3
|
4
|
4
|
4
|
|
| Uganda
|
|
|
|
|
| Social
Expenditure |
306
|
349
|
400
|
4362
|
| Social
Expenditure/Government Revenue (in percent)
|
40
|
39
|
39
|
36
|
| Social
Expenditure/GDP (in percent)
|
5
|
6
|
6
|
6
|
|
| Zambia
|
|
|
|
|
| Social
Expenditure |
167
|
152
|
248
|
2632
|
| Social
Expenditure/Government Revenue (in percent)
|
30
|
24
|
39
|
38
|
| Social
Expenditure/GDP (in percent)
|
5
|
5
|
7
|
7
|
|
| Total
social expenditure |
4,140
|
4,778
|
5,540
|
6,302
|
| Ratio
of social expenditure to government revenue |
|
Simple average |
39
|
41
|
44
|
45
|
|
Weighted average |
34
|
37
|
38
|
39
|
| Ratio
of social expenditure to GDP
|
| Simple average |
7
|
7
|
8
|
9
|
|
Weighted average |
5
|
6
|
7
|
7
|
Sources: HIPC country
documents; and staff estimates.
1The figures for 2000 for
Cameroon, Chad, The Gambia, Guinea, Guinea-Bissau,
Guyana, Madagascar, Malawi, Mauritania,
Nicaragua, Niger, Rwanda, Sao Tome and
Principe, and Zambia largely reflect
social expenditure before HIPC relief
in 2000 because these countries did not
reach their decision point until late
2000 or later (Chad). Thus, the full
impact of relief for these countries
will not be felt until 2001 (or 2002,
for Chad).
2For the six countries where
no data is available for 2002 (Benin,
Bolivia, Guinea, Senegal, Uganda and
Zambia), social expenditure has been
assumed to remain unchanged as a percentage
of GDP from the previous year.
|